PROBLEMS INVOLVING BAR GRAPH
Subscribe to our ▶️ YouTube channel 🔴 for the latest videos, updates, and tips.
Bar graph is a graphical chart which is used to compare the events or frequencies of the given data. This graph is drawn to represent frequency distribution table.
The following types of graphs are for one independent and one dependent variable.
Types for one independent and one dependent variable:
- Vertical
- Horizontal
- Range
Example 1 :
The number of bed sheets manufactured by a factory during five consecutive weeks is given below.
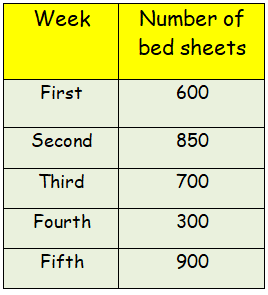
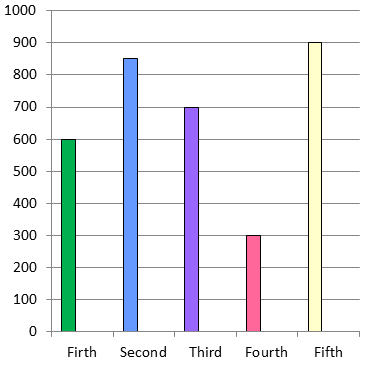
Draw the bar graph representing the above data.
Solution :
Draw the horizontal and vertical axis, Scale of vertical axis is 100 units.
Horizontal axis - Week
Vertical axis - Number of bedsheets
Example 2 :
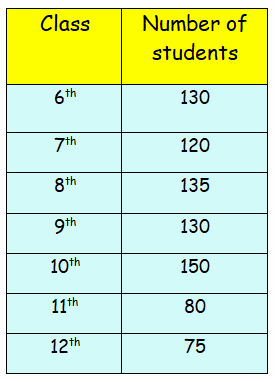
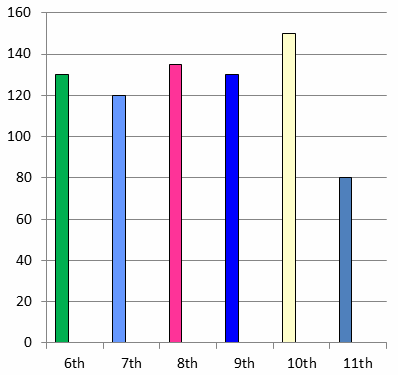
Draw the bar graph representing the above data.
Solution :
Draw the horizontal and vertical axis, Scale of vertical axis is 20 units.
Horizontal axis - Class
Vertical axis - Number of students
Example 3 :
The number of absentees in class VIII was recorded in a particular week. Represent this data on the bar graph
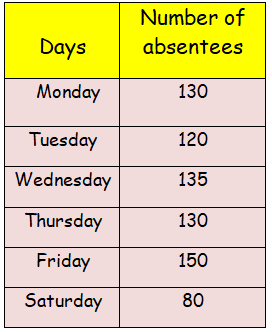
(a) On which day the maximum and minimum students were absent?
(b) How many students were absent on Wednesday and Friday?
(c) On which days the same number of students was absent?
Solution :
Draw the horizontal and vertical axis, Scale of vertical axis is 20 units.
Horizontal axis - Days
Vertical axis - Number of absentees
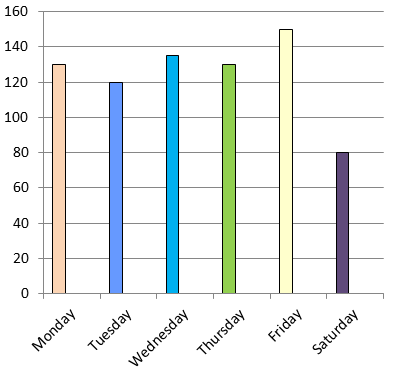
(a) By observing the graph, on Friday the maximum number of students were absent.
(b) Number of students were absent in Wednesday and Friday is
= 135+150
= 285 students
(c) On Monday and Thursday same number of students were absent.
Example 4 :
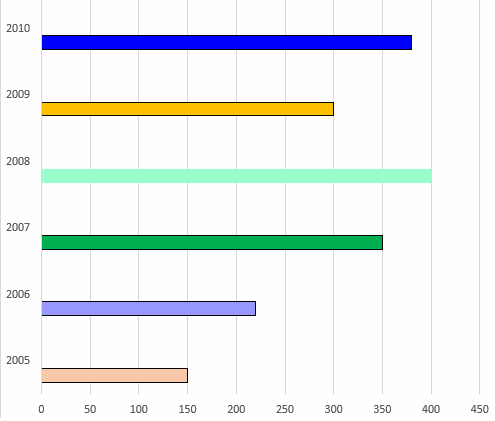
The number of trees planted by Eco-club of a school in different years is given below.
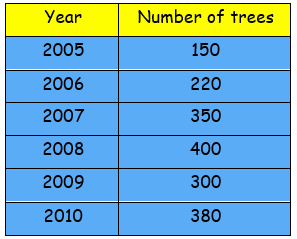
Draw the bar graph to represent the data.
Solution :
Draw the horizontal and vertical axis, Scale of horizontal axis is 50 units.
Horizontal axis - Number of trees
Vertical axis - Year
Example 4 :
A randomly selected sample of small businesses has been asked, “How many full-time employees are there in your business?”. A column graph has been constructed for the results.
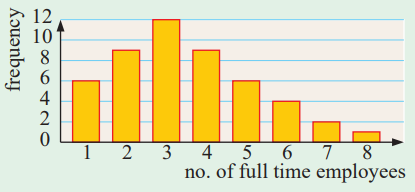
a) How many small businesses gave data in the survey?
b) How many of the businesses had only one or two full-time employees?
c) What percentage of the businesses had five or more full-time employees?
Solution :
1 employee = 6 times
(a) Number of small businesses gave data
= 6 + 9 + 12 + 9 + 6 + 4 + 2 + 1
= 49
(b) Number of businesses have one or two full time employees
= 6 + 9
= 15
(c) Number of businesses have 5 or more full time employees = 6 + 4 + 2 + 1
= 13
Percentage = (13/49) x 100%
= 26.53%
Example 5 :
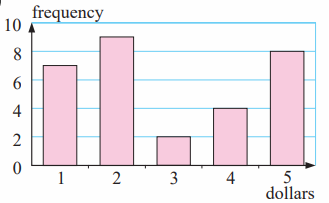
The frequency column graph alongside gives the value of donations for an overseas aid organization, collected in a particular street.
a) Determine the total number of donations.
b) For the donations find the:
i) mean ii) median iii) mode.
Solution :
(a) Total number of donations = 7+9+2+4+8
= 30
(b) Mean = Amount of donation collected / number of donation
= [1(7) + 9(2) + 2(3) + 4(4) + 8(5)] / 30
= (7+18+6+16+40)/30
= $2.9
Median :
Number of donations = 30 (even)
= 30/2
= 15th
So, $2 is the median.
Mode :
$2 is most repeated donation. So mode is $2.
Example 6 :
There are five entry gates at an open air concert. This bar chart shows how many people went through each gate.

a) How many more people went through gate C than gate D?
b) How many gates had fewer than 150 people go through?
Solution :
a) Number of people entering into gate C = 250
Number of people entering into gate D = 100
Difference between them = 250 - 100
= 150
b) The people who are entering into the gate A and D are lesser than 150.
Example 7 :
Class 6 did a survey of their favorite types of story book. Here are their results.

a) How many more children chose adventure books than fantasy books?
b) Five girls chose animal books. How many boys chose animal books?
Solution :
a) Number of children they choose adventure books = 9
Number of children they choose fantasy books = 4
Difference = 9 - 4
= 5
So, 5 more students they chose adventure books than fantasy books.
b) Total number of students who choose animal books = 7
Number of girls who chose animal book = 5
Number of boys who chose animal book = 7 - 5
= 2
Example 8 :
Tom does a survey of children’s favourite breakfast cereals. These are the results for Class 6

How many more children in class 6 prefer Choc Grain than Golden Corn ?
Solution :
Number of children who prefer Choc Grain = 10
Number of children who prefer Golden corn = 3
Difference = 10 - 3
= 7
So, 7 more students they prefer Choc Grain than Golden Corn.
Example 9 :

How many children in both classes like Honey Bites best?
Solution :
Number of children who like honey bites in class 6 = 6
Number of children who like honey bites in class 5 = 9
Total number of children they like honey bites = 6 + 9
= 15
Subscribe to our ▶️ YouTube channel 🔴 for the latest videos, updates, and tips.
Kindly mail your feedback to v4formath@gmail.com
We always appreciate your feedback.
About Us | Contact Us | Privacy Policy
©All rights reserved. onlinemath4all.com

Recent Articles
-
Digital SAT Math Questions and Answers (Part - 13)
May 10, 26 05:50 PM
 Digital SAT Math Questions and Answers (Part - 13)
 -
Problems on Solving Logarithmic Equations
Apr 24, 26 09:30 PM
Problems on Solving Logarithmic Equations -
Solving Logarithmic Equations Worksheet
Apr 24, 26 09:05 PM
 Solving Logarithmic Equations Worksheet