MEAN MEDIAN AND MODE OF GROUPED DATA AND FREQUENCY TABLE
Subscribe to our ▶️ YouTube channel 🔴 for the latest videos, updates, and tips.
What is frequency table ?
A frequency table is a table that lists items and shows the number of times the items occur. Its represented by the symbol ‘ f ’.
Mean :
To find the mean, multiply the values by frequencies, add the subtotals, and divide by the total number of the frequency.
Mean = ∑xf/N
(where x, f and N are values, frequencies and total no.of. frequency)
Median :
To find the median, calculate a running total of the frequencies, which is half the total, it contains the median that corresponds to the value.
Median = ∑f/2
Mode :
Mode is defined as the value which occurs most frequently. It is the value that corresponds to the maximum frequency.
Example 1 :
The table given shows the result when 3 coins were tossed simultaneously 40 times. The number of heads appearing was recorded.
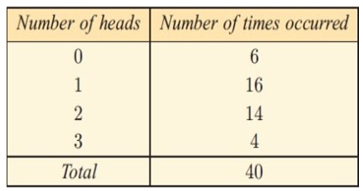
Calculate the : a) mean b) median c) mode
Solution :
a) Mean :
Let the number of heads be x and number of times occurred be f
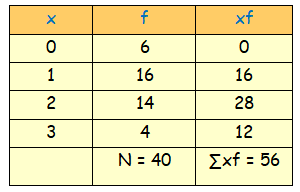
By using the formula,
Mean = (∑xf)/N
= (56)/40
Mean = 1.4
b) Median :
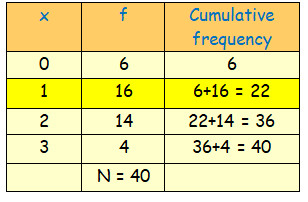
Here, the total frequency N = ∑f = 40
N/2 = 40/2 = 20
The median is (N/2)th value = 20th value
Now, 20th value occurs in the cumulative frequency 22, whose corresponding x value is 1
So, the median = 1
c) Mode :
By observing the given data set, the number 1 occurs more number of times. That is 16 times.
So, the mode = 1
Example 2 :
The following frequency table records the number of
text messages sent in a day by 50 fifteen-years-olds
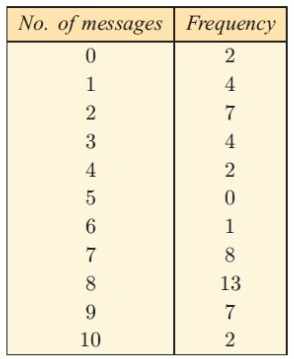
a) For this data, find the : (i) mean (ii) median (iii) mode
b) construct a column graph for the data and show the position of the measures of centre (mean, median and mode) on the horizontal axis.
c) Describe the distribution of the data.
d) why is the mean smaller than the median for this data ?
e) which measure of centre would be the most suitable for this data set ?
Solution :
a)
(i) Mean :
Let the number of messages be x and frequency be f

By using the formula,
Mean = (∑xf)/N
= (287)/50
Mean = 5.74
(ii) Median :
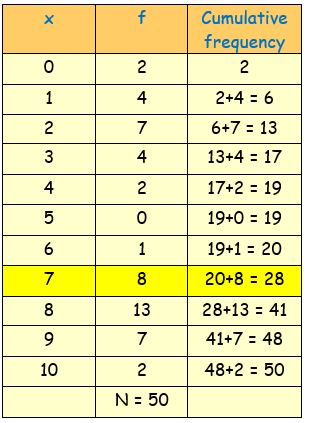
Here, the total frequency N = ∑f = 50
N/2 = 50/2 = 25
The median is (N/2)th value = 25th value
Now, 25th value occurs in the cumulative frequency 28, whose corresponding x value is 7
So, the median = 7
(iii) Mode :
By observing the given data set, the number 8 occurs more number of times. That is 13 times.
So, the mode = 8
(b)
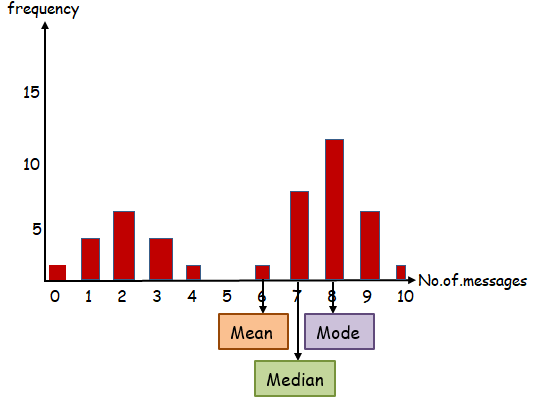
c)
By observing the graph of the data set, it has been divided into two data distribution, in each distribution, we see mode.
So, it is bimodal data.
d)
The mean takes into account the full range of numbers of text messages and is affected by extreme values. Also, the value which is lower than the median is well below it.
e)
The median
Example 3 :
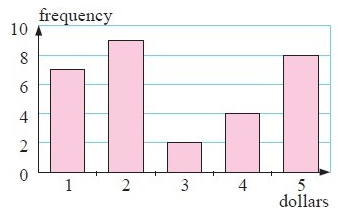
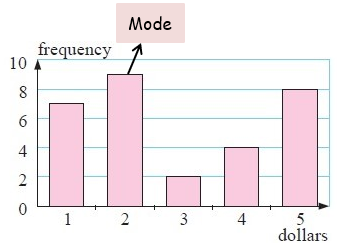
The frequency column graph alongside gives the value of donations for an overseas aid organisation, collected in a particular street.
a) construct the frequency table from the graph.
b) Determine the total number of donations.
c) For the donations find the : (i) mean (ii) median (iii) mode
d) which of the measures of central tendency can be found easily from the graph only ?
Solution :
(a)
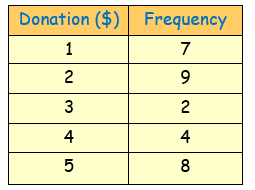
b)
Here, the total number of donation N = ∑f = 30
c)
(i) Mean :
Let the donation be x and frequency be f
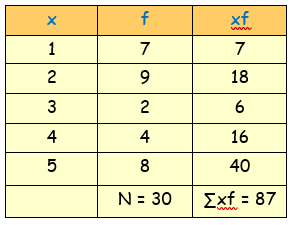
By using the formula,
Mean = (∑xf)/N
= (87)/30
Mean = $2.9
(ii) Median :
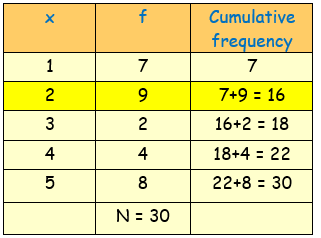
Here, the total frequency N = ∑f = 30
N/2 = 30/2 = 15
The median is (N/2)th value = 15th value
Now, 15th value occurs in the cumulative frequency 16, whose corresponding x value is 2
So, the median = $2
(iii) Mode :
By observing the given data set, the number 2 occurs more number of times. That is 9 times.
So, the mode = $2
d)
Example 4 :
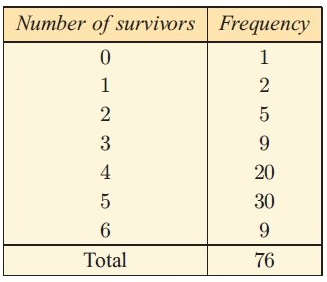
Hui breeds ducks. The number of ducklings surviving for each pair after one month is recorded in the table.
a) Calculate the : (i) mean (ii) median (iii) mode
b) Is the data skewed ?
c) How does the skewness of the data affect the measures of the middle of the distribution ?
Solution :
a)
(i) Mean :
Let the number of survivors be x and frequency be f.
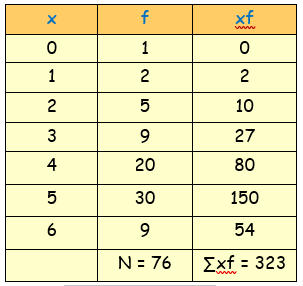
Mean = (∑xf)/N
= (323)/76
Mean = 4.25
(ii) Median :
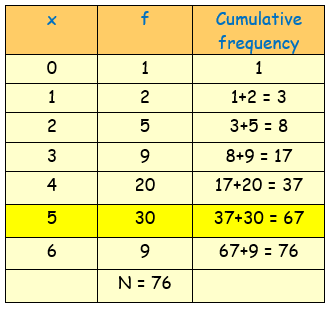
Here, the total frequency N = ∑f = 76
N/2 = 76/2 = 38
The median is (N/2)th value = 38th value
Now, 38th value occurs in the cumulative frequency 67, whose corresponding x value is 5
So, the median = 5
(iii) Mode :
By observing the given data set, the number 5 occurs more number of times. That is 30 times.
So, the mode = 5
b)
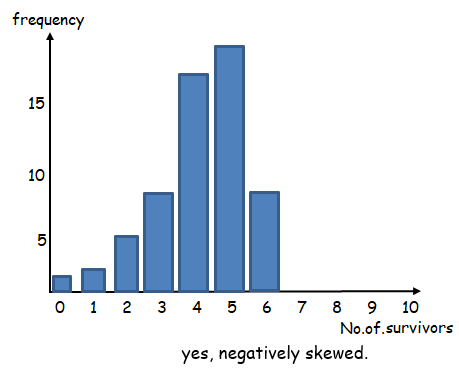
c) By observing the graph, the mean is less than the median and mode.
Example 5 :
Find the mean of the data in the pictograph below.

A. The mean is 13. B. The mean is 6
C. The mean is 2 D. The mean is 26.
Solution :
Number of shocks,
Julfanne = 1(2) ==> 2
Jose = 4(2) ==> 8
Chris = 3(2) ==> 6
Mack = 4(2) ==> 8
Mean = (2 + 8 + 6 + 8) / 12
= 24/12
= 2
So, the mean is 2, option C is correct.
Example 6 :
The following table shows the distances of different places from Rachel’s house. Calculate the mean distance.

A. The mean is 2.5 miles. B. The mean is 4 miles.
C. The mean is 15 miles. D. The mean is 3 miles.
Solution :
Mean = Total distance covered / total number of locations
= (5 + 1.5 + 4 + 2 + 2.5)/5
= 15/5
= 3
So, the mean is 3 miles, option D is correct.
Subscribe to our ▶️ YouTube channel 🔴 for the latest videos, updates, and tips.
Kindly mail your feedback to v4formath@gmail.com
We always appreciate your feedback.
About Us | Contact Us | Privacy Policy
©All rights reserved. onlinemath4all.com

Recent Articles
-
Digital SAT Math Questions and Answers (Part - 13)
May 10, 26 05:50 PM
 Digital SAT Math Questions and Answers (Part - 13)
 -
Problems on Solving Logarithmic Equations
Apr 24, 26 09:30 PM
Problems on Solving Logarithmic Equations -
Solving Logarithmic Equations Worksheet
Apr 24, 26 09:05 PM
 Solving Logarithmic Equations Worksheet