INTERPRETING GRAPHS WORKSHEET
Subscribe to our ▶️ YouTube channel 🔴 for the latest videos, updates, and tips.
Problem 1 :
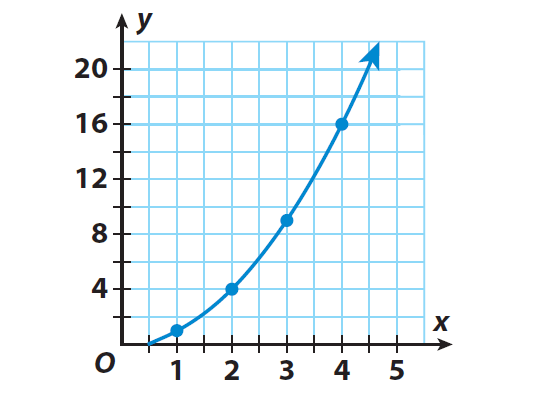
A square tile has a side length of x inches. The equation y = x2 gives the area of the tile in square inches. Determine whether the rate of change between the side length and area of a square is constant using the graph. And also describe whether the relationship between the two variables is linear.
Problem 2 :
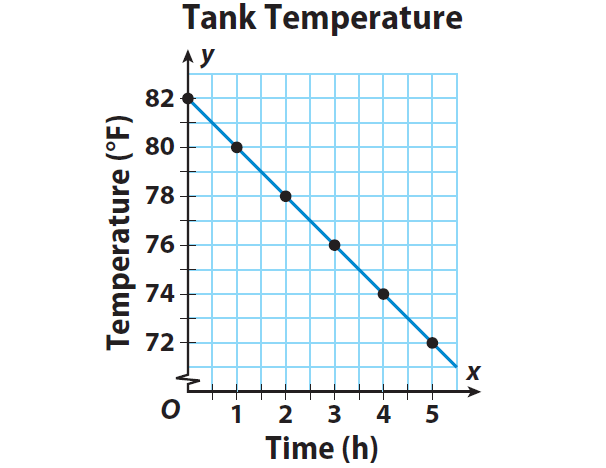
The temperature of a fish tank was 82°F and decreased steadily 2°F every hour. The equation y = -2x + 82 gives the temperature y after x hours. Determine whether the rate of change between the time and temperature is constant. And also describe whether the relationship between the two variables is linear.

Detailed Answer Key
Problem 1 :
A square tile has a side length of x inches. The equation y = x2 gives the area of the tile in square inches. Determine whether the rate of change between the side length and area of a square is constant using the graph. And also describe whether the relationship between the two variables is linear.
Solution :
Step 1 :
Choose several values for the input x. Plug these values for x in the equation to find the output y.
x
x2
y
(x, y)
1
12
1
(1, 1)
2
22
4
(2, 4)
3
32
9
(3, 9)
4
42
16
(4, 16)
Step 2 :
Graph the ordered pairs. Then draw a line through the points to represent the solutions of the function.
Step 3 :
Describe the relationship between x and y.
The graph is not a straight line. So the rate of change between the side length and area of a square is not constant.
Only a straight line graph will represent a linear relationship. Since the graph is not a straight line, the relationship between the two variables x and y is non linear.
Problem 2 :
The temperature of a fish tank was 82°F and decreased steadily 2°F every hour. The equation y = -2x + 82 gives the temperature y after x hours. Determine whether the rate of change between the time and temperature is constant. And also describe whether the relationship between the two variables is linear.
Solution :
Step 1 :
Choose several values for the input x. Plug these values for x in the equation to find the output y.
x
0
1
2
3
4
5
-2x + 82
-2(0) + 82
-2(1) + 82
-2(2) + 82
-2(3) + 82
-2(4) + 82
-2(5) + 82
y
82
80
78
76
74
72
(x, y)
(0, 82)
(1, 80)
(2, 78)
(3, 76)
(4, 74)
(5, 72)
Step 2 :
Graph the ordered pairs. Then draw a line through the points to represent the solutions of the function.
Step 3 :
Since the graph is a straight line, the rate of change between the time and temperature is constant.
Since the rate of change is constant and the graph is a straight line, the relationship between the two variables x and y is linear.
Subscribe to our ▶️ YouTube channel 🔴 for the latest videos, updates, and tips.
Kindly mail your feedback to v4formath@gmail.com
We always appreciate your feedback.
About Us | Contact Us | Privacy Policy
©All rights reserved. onlinemath4all.com

Recent Articles
-
Digital SAT Math Questions and Answers (Part - 13)
May 10, 26 05:50 PM
 Digital SAT Math Questions and Answers (Part - 13)
 -
Problems on Solving Logarithmic Equations
Apr 24, 26 09:30 PM
Problems on Solving Logarithmic Equations -
Solving Logarithmic Equations Worksheet
Apr 24, 26 09:05 PM
 Solving Logarithmic Equations Worksheet

