DRAWING TREND LINES WORKSHEET
Subscribe to our ▶️ YouTube channel 🔴 for the latest videos, updates, and tips.
Problem 1 :
Lily is getting trained for a 10K race. For some of her training runs, she records the distance she ran and how many minutes she ran.
Distance (miles)
4
2
1
2
3
5
2
4
3
Time (minutes)
38
25
07
16
26
55
20
45
31
Draw a trend line that shows the relationship between distance and time.
Problem 2 :
David records the number of chapters and the total number of pages for several books as given below.
No. of chapters
3
4
5
8
10
11
15
17
19
No. of pages
20
44
50
95
90
130
125
170
160
Draw a trend line that shows the relationship between the number of chapters and the number of pages.
Problem 3 :
Alex records the number of rainy days in a month and the number of umbrellas sold each month as given below.
No. of rainy days
3
3
4
4
5
7
8
10
No. of Umbrellas
1
3
3
7
5
5
6
10
Draw a trend line that shows the relationship between the number of rainy days in a month and the number of umbrellas sold each month.

Detailed Answer Key
Problem 1 :
Lily is getting trained for a 10K race. For some of her training runs, she records the distance she ran and how many minutes she ran.
Distance (miles)
4
2
1
2
3
5
2
4
3
Time (minutes)
38
25
07
16
26
55
20
45
31
Draw a trend line that shows the relationship between distance and time.
Solution :
Step 1 :
Make a scatter plot of Lily’s running data.
Step 2 :
To draw a trend line, use a straight edge to draw a line that has about the same number of points above and below it. Ignore any outliers.

Problem 2 :
David records the number of chapters and the total number of pages for several books as given below.
No. of chapters
3
4
5
8
10
11
15
17
19
No. of pages
20
44
50
95
90
130
125
170
160
Draw a trend line that shows the relationship between the number of chapters and the number of pages.
Solution :
Step 1 :
Make a scatter plot of the data given above.
Step 2 :
To draw a trend line, use a straight edge to draw a line that has about the same number of points above and below it. Ignore any outliers.

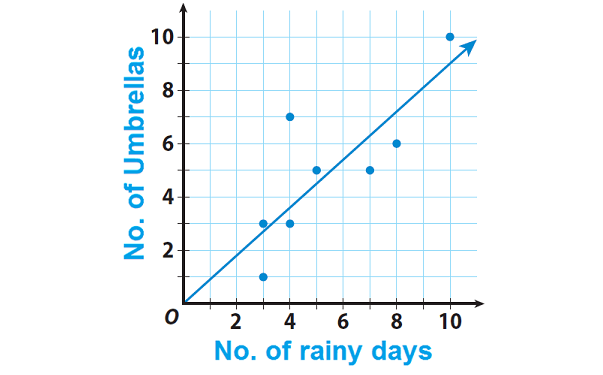
Problem 3 :
Alex records the number of rainy days in a month and the number of umbrellas sold each month as given below.
No. of rainy days
3
3
4
4
5
7
8
10
No. of Umbrellas
1
3
3
7
5
5
6
10
Draw a trend line that shows the relationship between the number of rainy days in a month and the number of umbrellas sold each month.
Solution :
Step 1 :
Make a scatter plot of the data given above.
Step 2 :
To draw a trend line, use a straight edge to draw a line that has about the same number of points above and below it. Ignore any outliers.
Subscribe to our ▶️ YouTube channel 🔴 for the latest videos, updates, and tips.
Kindly mail your feedback to v4formath@gmail.com
We always appreciate your feedback.
About Us | Contact Us | Privacy Policy
©All rights reserved. onlinemath4all.com

Recent Articles
-
Digital SAT Math Questions and Answers (Part - 13)
May 10, 26 05:50 PM
 Digital SAT Math Questions and Answers (Part - 13)
 -
Problems on Solving Logarithmic Equations
Apr 24, 26 09:30 PM
Problems on Solving Logarithmic Equations -
Solving Logarithmic Equations Worksheet
Apr 24, 26 09:05 PM
 Solving Logarithmic Equations Worksheet

