DATA HANDLING QUESTIONS FOR GRADE 4
Subscribe to our ▶️ YouTube channel 🔴 for the latest videos, updates, and tips.
Problem 1 :
Dawn kept a record of the number of minutes she walked on 16 different days. Her data is shown below.
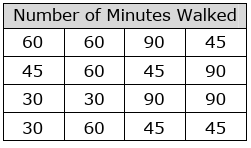
Dawn decided to create a frequency table using her data. What number will Dawn use on a frequency table to represent the number of times she walked 60 minutes?
A) 3 B) 5 C) 2 D) 4
Solution :
|
Data 30 45 60 90 |
Frequency 3 5 4 4 |
So, the answer is 4.
Problem 2 :
Sean is training to run at a cross country track meet. He recorded the number of miles he ran on different days.
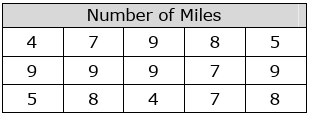
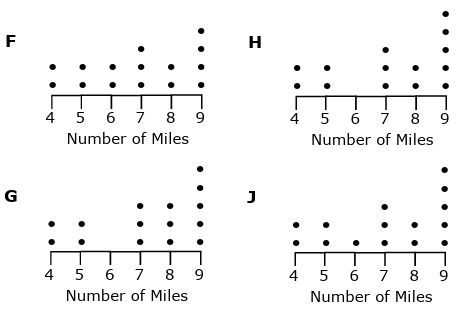
Which dot plot represents the data Sean recorded?
Solution :
|
Number of miles 4 5 7 8 9 |
Frequency 2 2 3 3 5 |
By comparing the frequency table and dot plot, option G is correct.
Problem 3 :
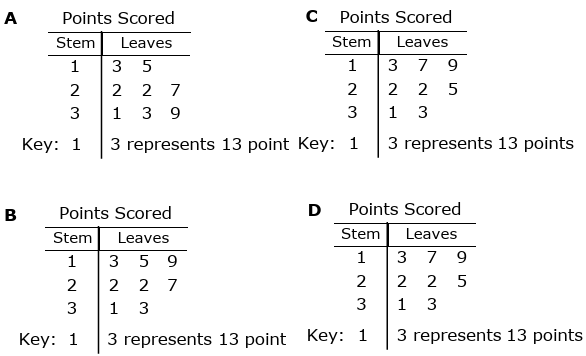
Keri recorded the number of points for each of the words she created during a word game.

Which stem-and-leaf plot represents the points Keri scored?
Solution :
Arranging the data from least to greatest,
13, 15, 19, 22, 22, 27, 31, 33
So, option C is correct.
Problem 4 :
Students in Juanita's class kept a record of the number of different types of birds each of them saw during recess. The data is shown below.

Juanita wants to make a dot plot to represent the data. How many dots will she place above the number 5?
F) 3 G) 1 H) 2 J) 5
Solution :
The values above 5 is 7
So, option G is the correct answer.
Problem 5 :
A fourth grade class attended a band concert. After the concert, the band conductor asked each student to name their favorite instrument. He recorded the data using tally marks.
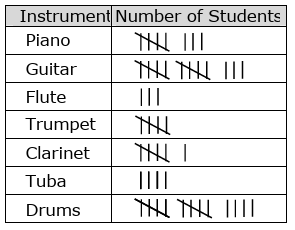
Write frequency table represents the number of students that chose each instrument and find the total number of students.
Solution :
|
Instrument Piano Guitar Flute Trumpet Clarinet Tuba Drums |
Frequency 8 13 3 5 6 4 14 |
Total number of students = 8 + 13 + 3 + 5 + 6 + 4 + 14
= 53 students.
Problem 6 :
The data shown below represents the height of students in Juan's class
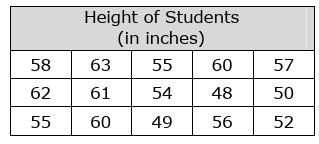
Juan has decided to create a stem and leaf plot to represent the heights. How many leaves will he put in the stem and leaf plot.
a) 10 b) 3 c) 12 d) 15
Solution :
Arranging the given values from least to greatest.
48, 49, 50, 52, 54, 55, 55, 56, 57, 58, 60, 60, 61, 62, 63
Stem Leaf
4 8 9
5 0 2 4 5 5 6 7 8
6 0 0 1 2 3
Total number of values is 15, then number of leaf will be 15. Option d is correct.
Problem 7 :
Jeri works her puppy each day. She recorded the distance they walked in the table below.
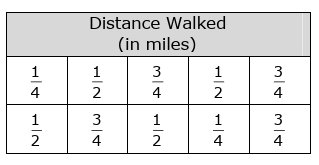
Jeri has decided to create frequency table to represent the data. What number should she use to represent the number of times they walked 3/4 mile.
a) 2 b) 5 c) 3 d) 4
Solution :
Number of times 3/4 miles = 4
Option d is correct.
Problem 8 :
Keith surveyed the students in his class to find the number of siblings each of them has. The data is shown below.
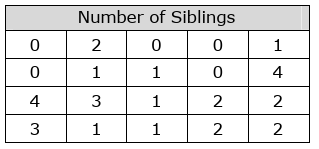
Keith wants to make a dot plot to represent the data. What data points will be labeled below the number line in the dot plot?
F) 1, 2, 3 G) 1, 2, 3, 4 H) 0, 1, 2 J) 0, 1, 2, 3, 4
Solution :
In the number line, we have to plot the points 0, 1, 2, 3, 4. so, option J is correct.
Problem 9 :
The list shows the numbers of books donated to a library on fourteen days.
0, 1, 4, 4, 6, 7, 8, 8, 9, 12, 12, 16, 16, 17
The librarian made this frequency table to show the data. The frequency table is not complete.
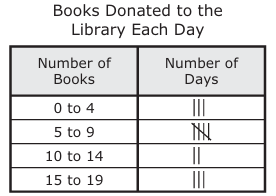
Which row of the frequency table is incomplete?
F) The row showing 0 to 4 books
G) The row showing 5 to 9 books
H) The row showing 10 to 14 books
J) The row showing 15 to 19 books
Solution :
0, 1, 4, 4, 6, 7, 8, 8, 9, 12, 12, 16, 16, 17
- Number of books in between 0 to 4 = 4
- Number of books in between 5 to 9 = 5
- Number of books in between 10 to 14 = 2
- Number of books in between 15 to 19 = 3
Observing the frequency table, number of books in between 0 to 4 must be 4 values. Here 3 is entered. So, option F the row showing 0 to 4 books is not completed.
Problem 10 :
The list shows the numbers of points a basketball team scored during the games the team played last season.
83, 98, 104, 88, 95, 98, 101, 89, 92, 89
The stem and leaf plot also shows these data.
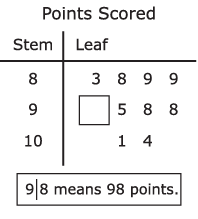
What number goes in the ___ to complete and stem and leaf plot ?
Solution :
92 is the missing value.
Subscribe to our ▶️ YouTube channel 🔴 for the latest videos, updates, and tips.
Kindly mail your feedback to v4formath@gmail.com
We always appreciate your feedback.
About Us | Contact Us | Privacy Policy
©All rights reserved. onlinemath4all.com

Recent Articles
-
SAT Math Problems and Solutions
Feb 14, 26 06:05 AM
SAT Math Problems and Solutions -
SAT Math Practice Questions with Answers
Feb 14, 26 05:47 AM
SAT Math Practice Questions with Answers -
SAT Math Practice Test with Answers
Feb 14, 26 02:30 AM
SAT Math Practice Test with Answers

