DATA ANALYSIS
Subscribe to our ▶️ YouTube channel 🔴 for the latest videos, updates, and tips.
The process of inspecting, cleansing, transforming and modeling data with the goal of discovering useful information, informing conclusions and supporting decision-making process is Data Analysis.
Example 1 :
Look at the data given in the table and answer the questions.

(i) In which year, is the production of rice maximum ?
(ii) What is the ratio between the production of wheat and rice in the year 2007 ?
(iii) How many metric tonnes of wheat was produced in the year 2005 ?
(iv) What is the difference between product of rice and wheat in the year 2008 ?
(v) What was the increase in production of rice from 2007 to 2008 in metric tonnes ?
Answers :
(i) 2008
(ii) 9 : 16
(iii) 12
(iv) 17
(v) 4
Example 2 :
Look at the data given in the histogram and answer the questions.
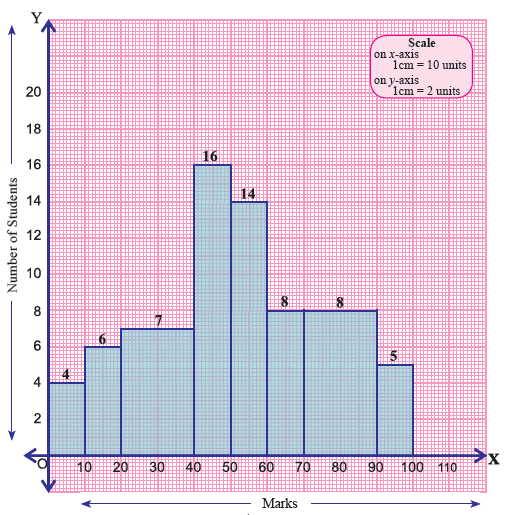
(i) How many students have scored marks from 0 to 10 ?
(ii) Find the interval of marks have been scored by maximum number of students.
(iii) How many students have scored marks from 70 to 90 ?
(iv) What is the difference between the number of students in scoring marks from 60 to 70 and 90 to 100 ?
(v) Find the total number of students in the mark interval 40 to 60.
Answers :
(i) 4
(ii) 40 to 50
(iii) 8
(iv) 3
(v) 30
Example 3 :
Look at the data given in the histogram and answer the questions.
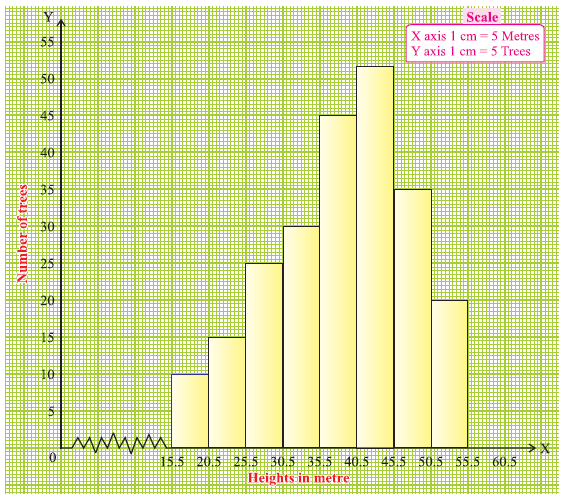
(i) How many trees do have the height from 15.5 to 20.5 meters ?
(ii) Find the interval of height where the maximum number of trees are there.
(iii) How many trees do have the height from 35.5 to 40.5 meters ?
(iv) What is the difference between the number of trees in the height 20.5 to 25.5 and 45.5 to 50.5 ?
(v) Find the total number of trees in the height interval 45.5 to 55.5 meters.
Answers :
(i) 10
(ii) 40.5 to 45.5
(iii) 45
(iv) 20
(v) 55
Example 4 :
400 students were asked about their favorite sport and information received from them is given as pie chart. Use the information given below and answer the questions.
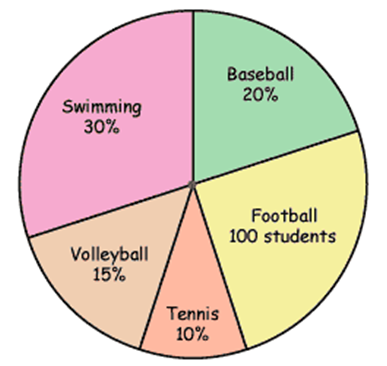
(i) How many students prefer swimming ?
(ii) What percentage of students like foot ball ?
(iii) What is the difference between the students who like foot ball and swimming ?
(iv) How many students would like to play volley ball ?
(v) Which sport do most of the students like ?
Answers :
(i) 120
(ii) 25%
(iii) 20
(iv) 60
(v) Swimming
Subscribe to our ▶️ YouTube channel 🔴 for the latest videos, updates, and tips.
Kindly mail your feedback to v4formath@gmail.com
We always appreciate your feedback.
About Us | Contact Us | Privacy Policy
©All rights reserved. onlinemath4all.com

Recent Articles
-
Digital SAT Math Questions and Answers (Part - 13)
May 10, 26 05:50 PM
 Digital SAT Math Questions and Answers (Part - 13)
 -
Problems on Solving Logarithmic Equations
Apr 24, 26 09:30 PM
Problems on Solving Logarithmic Equations -
Solving Logarithmic Equations Worksheet
Apr 24, 26 09:05 PM
 Solving Logarithmic Equations Worksheet