COMPARING A TABLE AND A GRAPH WORKSHEET
Subscribe to our ▶️ YouTube channel 🔴 for the latest videos, updates, and tips.
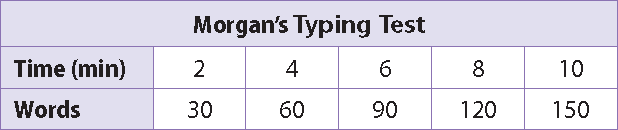
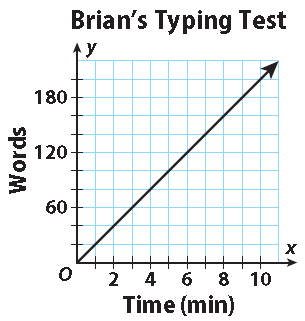
The table and graph show how many words Morgan and Brian typed correctly on a typing test. For both students, the relationship between words typed correctly and time is linear.
Answer the following questions :
(i) Find Morgain's unit rate .
(ii) Find Brian's unit rate .
(iii) Which student types more correct words per minute?
(iv) Katie types 17 correct words per minute. Explain how a graph of Katie’s test results would compare to Morgan’s and Brian’s.

Detailed Answer Key
(i) Find Morgain's unit rate .
m = (60 - 30) / (4 - 2)
m = 30 / 2
m = 15
So, Morgan's unit rate is 15 words per minute.
(ii) Find Brian's unit rate .
m = (80 - 40) / (4 - 2)
m = 40 / 2
m = 20
So, Morgan's unit rate is 20 words per minute.
(iii) Which student types more correct words per minute?
Brian types 5 more correct words per minute.
(iv) Katie types 17 correct words per minute. Explain how a graph of Katie’s test results would compare to Morgan’s and Brian’s.
Katie’s graph would go through the origin. Katie’s graph would be less steep than Brian’s but steeper than Morgan’s.
Subscribe to our ▶️ YouTube channel 🔴 for the latest videos, updates, and tips.
Kindly mail your feedback to v4formath@gmail.com
We always appreciate your feedback.
About Us | Contact Us | Privacy Policy
©All rights reserved. onlinemath4all.com

Recent Articles
-
Digital SAT Math Questions and Answers (Part - 13)
May 10, 26 05:50 PM
 Digital SAT Math Questions and Answers (Part - 13)
 -
Problems on Solving Logarithmic Equations
Apr 24, 26 09:30 PM
Problems on Solving Logarithmic Equations -
Solving Logarithmic Equations Worksheet
Apr 24, 26 09:05 PM
 Solving Logarithmic Equations Worksheet

