MARGINAL RELATIVE FREQUENCY WORKSHEET
Subscribe to our ▶️ YouTube channel 🔴 for the latest videos, updates, and tips.
Question 1 :
A survey is conducted among school students. 50 students are randomly selected and they are asked, whether they prefer dogs, cats or other pets. The table given below shows the results of the survey.
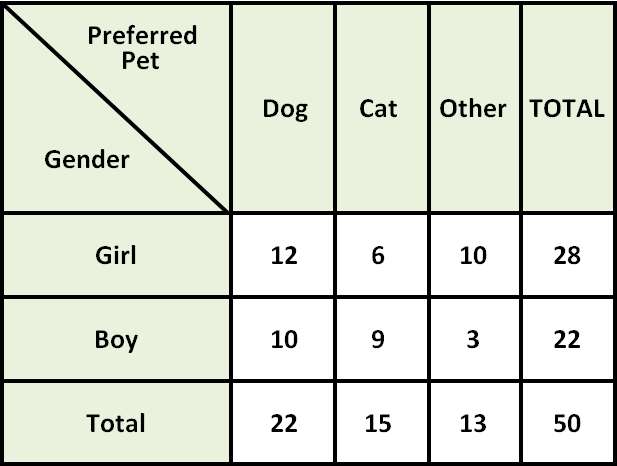
Use the above table to find each marginal relative frequency.
(i) Find the marginal relative frequency of the students who prefer cats as pets.
(ii) Find the marginal relative frequency of boys.
(iii) Find the marginal relative frequency of girls.
(iv) Find the marginal relative frequency of the students who prefer dogs as pets.
Solution :
Part (i) :
Divide the total number of students who prefer cats as pets by the grand total. Express your answer as a decimal and as a percent.
15/50 = 0.30 = 30%
Part (ii) :
Divide the total number of boys by the grand total. Express your answer as a decimal and as a percent.
22/50 = 0.44 = 44%
Part (iii) :
Divide the total number of girls by the grand total. Express your answer as a decimal and as a percent.
28/50 = 0.56 = 56%
Part (vi) :
Divide the total number of students who prefer dogs as pets by the grand total. Express your answer as a decimal and as a percent.
22/50 = 0.44 = 44%
Question 2 :
A survey is made among 100 students in a middle school. They are asked, how they travel to school. The table given below shows the results of the survey.
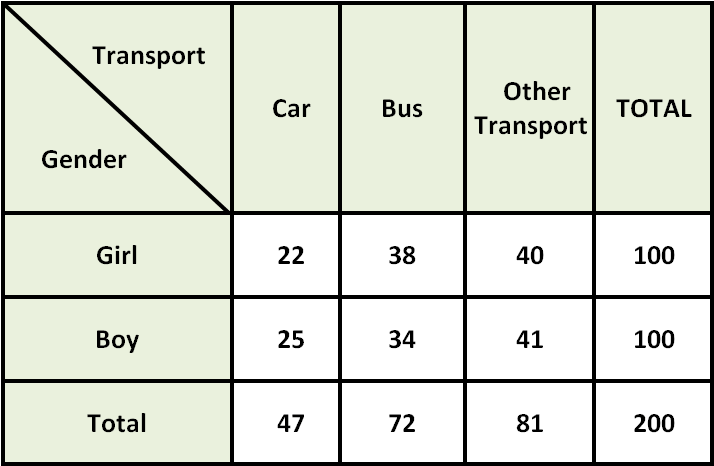
Use the above table to find each conditional relative frequency.
(i) Find the marginal relative frequency of the students who prefer car.
(ii) Find the marginal relative frequency of boys.
(iii) Find the marginal relative frequency of girls.
(iv) Find the marginal relative frequency of the students who prefer bus.
Solution :
Part (i) :
Divide the total number of students who prefer car by the grand total. Express your answer as a decimal and as a percent.
47/200 ≈ 0.24 = 24%
Part (ii) :
Divide the total number of boys by the grand total. Express your answer as a decimal and as a percent.
100/200 = 0.50 = 50%
Part (iii) :
Divide the total number of girls by the grand total. Express your answer as a decimal and as a percent.
100/200 = 0.50 = 50%
Part (iv) :
Divide the total number of students who prefer bus by the grand total. Express your answer as a decimal and as a percent.
72/200 = 0.36 = 36%
Question 3 :
The two-way table shows the results of a survey that asked college-bound high school students whether they plan to major in a medical field. Make a two-way table that shows the joint and marginal relative frequencies.

Solution :
Total number of students in this survey
= 124 + 219 + 101 + 236
= 680
Percentage of Major in medical field who are junior (YES):
= (124/680) x 100%
= 0.182 x 100%
= 18.2%
Percentage of Major in medical field who are junior (NO) :
= (219/680) x 100%
= 0.322 x 100%
= 32.2%
= 32.2% + 18.2%
= 50.4%
About 50% of the students are juniors.
Percentage of Major in medical field who are Senior (YES):
= (101/680) x 100%
= 0.148 x 100%
= 14.8%
Percentage of Major in medical field who are Senior (NO) :
= (236/680) x 100%
= 0.347 x 100%
= 34.7%
= 14.8% + 34.7%
= 49.5%
About 50% of the students are senior.
Question 4 :
You conduct a survey that asks 346 students whether they buy lunch at school. Use the results of the survey shown in the two-way table.

a) How many freshmen were surveyed?
b) How many sophomores were surveyed?
c) How many students buy lunch at school?
d) How many students do not buy lunch at school?
Solution :
a) Number of freshmen were surveyed = 92 + 86
= 178
b) Number of sophomores were surveyed = 116 + 52
= 168
c) Number of students who buy lunch at school = 92 + 116
= 208
d) Number of students who donot buy lunch at school
= 86 + 52
= 138
Question 5 :
You conduct a survey that asks college-bound high school seniors about the type of degree they plan to receive. The results are shown in the two-way table. Find and interpret the marginal frequencies.

Solution :
Total number of males = 58 + 126 + 42
= 226
Total number of female = 62 + 118 + 48
= 228
Number of associates = 58 + 62
= 120
Number of Bachelor's = 126 + 118
= 244
Number of Master's = 42 + 48
= 90
Question 6 :
Complete the two-way table.

Solution :
Number of students who traveled on airplane = 274
Number of sophomore who do not travel on airplane = 184
Number of freshman who has traveled on airplane
= 274 - 184
= 90
Number of freshman who donot travel on airplane = 62
Total number of students as freshman and sophomore who has been travelled on airplane and not
= 352
Number of sophomore who donot travel on airplane
= 78 - 62
= 16
Total number of freshman = 90 + 62
= 152
Total number of sophomore = 184 + 16
= 200

Subscribe to our ▶️ YouTube channel 🔴 for the latest videos, updates, and tips.
Kindly mail your feedback to v4formath@gmail.com
We always appreciate your feedback.
About Us | Contact Us | Privacy Policy
©All rights reserved. onlinemath4all.com
Recent Articles
-
10 Hard SAT Math Questions (Part - 38)
Dec 29, 25 04:21 AM
 10 Hard SAT Math Questions (Part - 38)
 -
10 Hard SAT Math Questions (Part - 39)
Dec 28, 25 11:20 PM
10 Hard SAT Math Questions (Part - 39) -
10 Hard SAT Math Questions (Part - 41)
Dec 28, 25 06:05 PM
 10 Hard SAT Math Questions (Part - 41)