LINEAR RELATIONSHIPS AND BIVARIATE DATA WORKSHEET
Subscribe to our ▶️ YouTube channel 🔴 for the latest videos, updates, and tips.
Problem 1 :
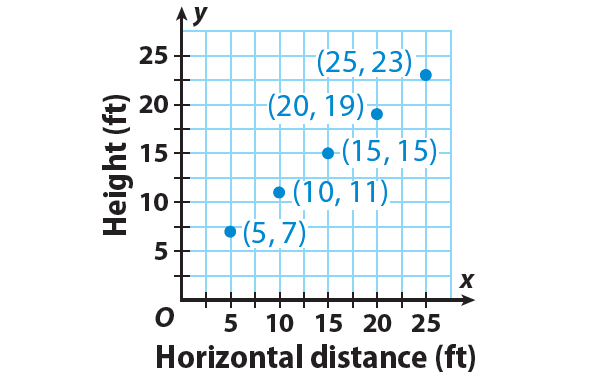
A handrail runs alongside a stairway. As the horizontal distance from the bottom of the stairway changes, the height of the handrail changes. Show that the relationship is linear, and then find the equation for the relationship.
Problem 2 :
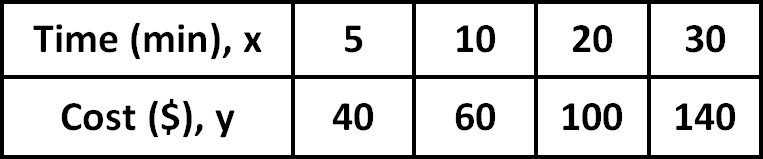
The table shows the relationship between time and cost. Show that the relationship is linear, and then find the equation for the relationship.

Detailed Answer Key
Problem 1 :
A handrail runs alongside a stairway. As the horizontal distance from the bottom of the stairway changes, the height of the handrail changes. Show that the relationship is linear, and then find the equation for the relationship.
Solution :
Step 1 :
Connect the points in the graph given above.
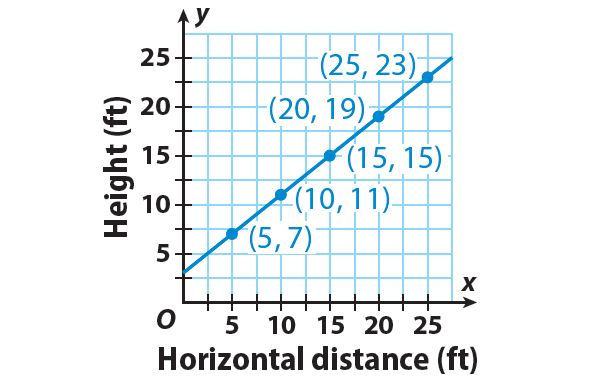
Since all of the points (5, 7), (10, 11), (15, 15), (20, 19), and (25, 23) lie on the same line, the relationship is linear.
Step 2 :
Choose any two points in the form (x, y), from the graph to find the slope :
For example, let us choose (5, 7) and (10, 11).
Use the slope formula.
m = (y2 - y1) / (x2 - x1)
Substitute :
(x1, y1) = (5, 7)
(x2, y2) = (10, 11)
Then,
m = (11 - 7) / (10 - 5)
m = 4 / 5
m = 0.8
Step 3 :
Choose a point and use the slope to find the value of 'b' (y-intercept b).
Substitute the point (5, 7) and m = 0.8 in the equation
y = mx + b
7 = (0.8)(5) + b
7 = 4 + b
3 = b
Step 4 :
To get the equation of the given linear relationship, substitute m = 0.8 and b = 3 in the equation y = mx + b.
y = 0.8x + 3
Problem 2 :
The table shows the relationship between time and cost. Show that the relationship is linear, and then find the equation for the relationship.
Solution :
Step 1 :
From the table, write the points in the form (x, y).
(5, 40), (10, 60), (20, 100) and (30, 140)
Step 2 :
Plot all the points in a graph paper and connect them.
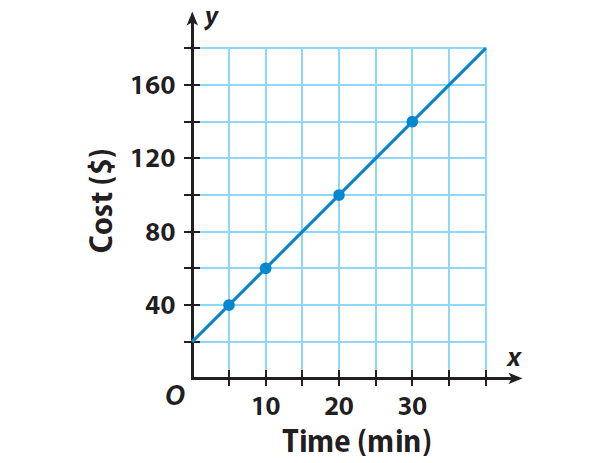
Since all of the points (5, 40), (10, 60), (20, 100) and (30, 140) lie on the same line, the relationship is linear.
Step 3 :
Choose any two points in the form (x, y), from the graph to find the slope :
For example, let us choose (5, 40) and (10, 60).
Use the slope formula.
m = (y2 - y1) / (x2 - x1)
Substitute :
(x1, y1) = (5, 40)
(x2, y2) = (10, 60)
Then,
m = (60 - 40) / (10 - 5)
m = 20 / 5
m = 4
Step 4 :
Choose a point and use the slope to find the value of 'b' (y-intercept b).
Substitute the point (5, 40) and m = 4 in the equation
y = mx + b
40 = (4)(5) + b
40 = 20 + b
20 = b
Step 5 :
To get the equation of the given linear relationship, substitute m = 4 and b = 20 in the equation y = mx + b.
y = 4x + 20
Subscribe to our ▶️ YouTube channel 🔴 for the latest videos, updates, and tips.
Kindly mail your feedback to v4formath@gmail.com
We always appreciate your feedback.
About Us | Contact Us | Privacy Policy
©All rights reserved. onlinemath4all.com

Recent Articles
-
SAT Math Practice Problems with Answers
May 21, 26 01:17 AM
 SAT Math Practice Problems with Answers
 -
Digital SAT Math Questions and Answers (Part - 13)
May 17, 26 09:03 AM
 Digital SAT Math Questions and Answers (Part - 13)
 -
Problems on Solving Logarithmic Equations
Apr 24, 26 09:30 PM
Problems on Solving Logarithmic Equations

