IDENTIFYING FUNCTIONS FROM GRAPHS WORKSHEET
Subscribe to our ▶️ YouTube channel 🔴 for the latest videos, updates, and tips.
Problem 1 :
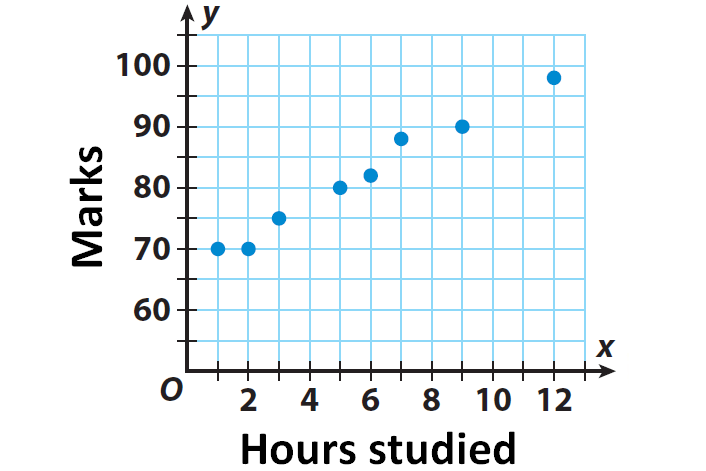
The graph given below shows the relationship between the number of hours students spent studying for an exam and the marks scored in the exam. Determine whether the relationship represented by the graph is a function.
Problem 2 :
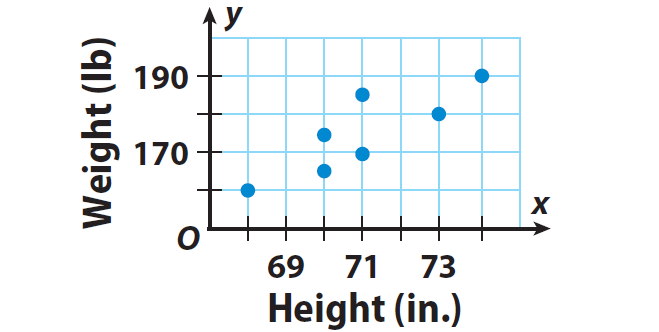
The graph shows the relationship between the heights and weights of the members of a basketball team. Is the relationship represented by the graph a function? Explain.
Problem 3 :
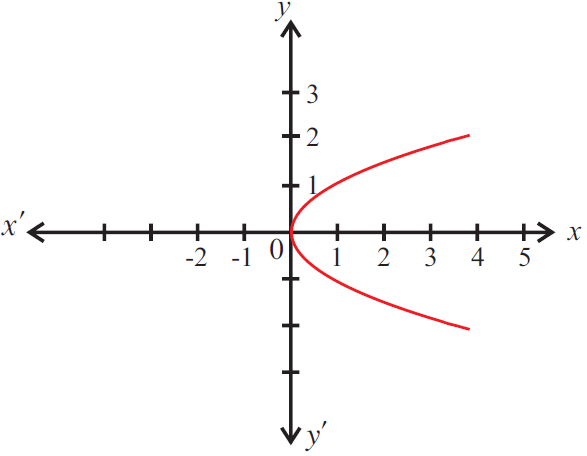
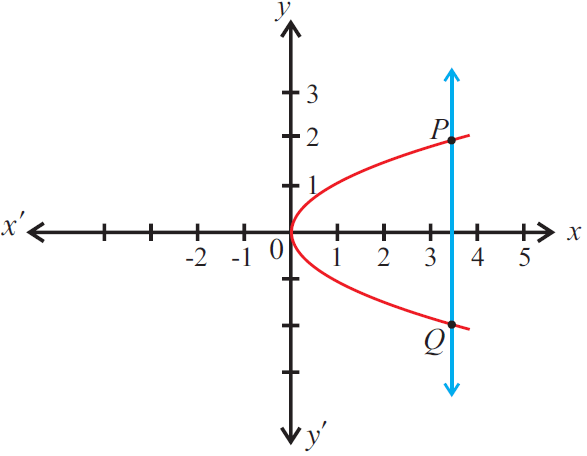
Use the vertical line test to determine whether the graph given below represents a function.
Problem 4 :
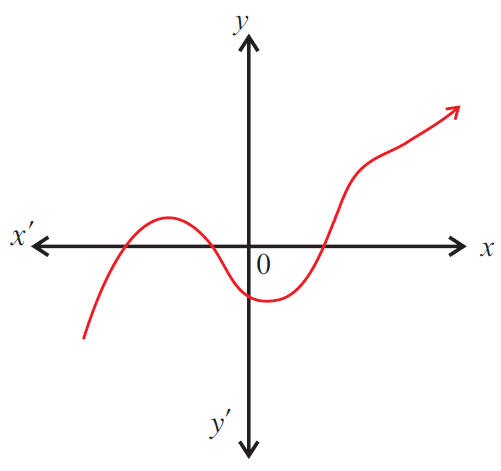
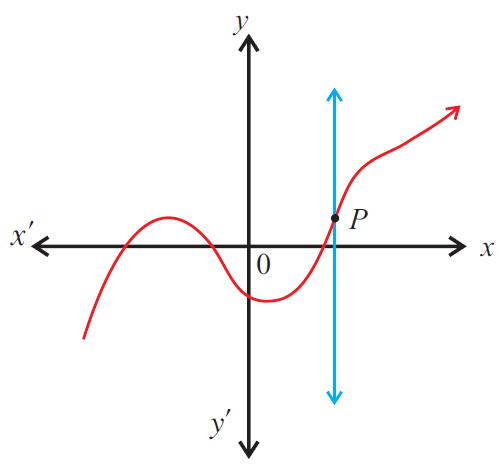
Use the vertical line test to determine whether the graph given below represents a function.
Problem 5 :
Many real-world relationships are functions. For example, the amount of money made at a car wash is a function of the number of cars washed. Give another example of a real-world function.

Answers
1. Answer :
From the graph, it is clear that if a student spends 2 hours for studying, he/she will be able to score 70 marks in the exam. And if he spends 9 hours for studying, he will be able to score 90 marks in the exam.
So, we can consider the number of hours of studying as input values and marks scored in the exam as output values.
The points represent the following ordered pairs in the form (input, output) or (x, y) :
(1, 70), (2, 70), (2, 85), (3, 75), (5, 80), (6, 82), (7, 88),
(9, 90), (9, 95) and (12, 98)
In the above order pairs, there is only one output value for each input value. And no input value has more than one output value.
Since, there is only one output value for each input value, the relationship represented by the graph is a function.
2. Answer :
From the graph, it is clear that if the height of a member is 73 inches, his weight will be 180 lbs.
So, we can consider the height as input value and weight as output value.
The points represent the following ordered pairs in the form (input, output) or (x, y) :
(68, 160), (70, 165), (70, 175), (71, 170), (71, 185),
(73, 180) and (74, 190)
Notice that 70 is paired with both 165 and 175, and 71 is paired with both 170 and 185. These input values are paired with more than one output value
Since, there is more than one output value for the input values 70 and 71, the relationship represented by the graph is not a function.
3. Answer :
The given graph does not represent a function as a vertical line cuts the graph at two points P and Q.
4. Answer :
The given graph represents a function as any vertical line will intersect the graph at most one point P.
5. Answer :
The amount earned at an hourly-wage is a function of the number of hours worked.
Subscribe to our ▶️ YouTube channel 🔴 for the latest videos, updates, and tips.
Kindly mail your feedback to v4formath@gmail.com
We always appreciate your feedback.
About Us | Contact Us | Privacy Policy
©All rights reserved. onlinemath4all.com

Recent Articles
-
Digital SAT Math Questions and Answers (Part - 13)
May 10, 26 05:50 PM
 Digital SAT Math Questions and Answers (Part - 13)
 -
Problems on Solving Logarithmic Equations
Apr 24, 26 09:30 PM
Problems on Solving Logarithmic Equations -
Solving Logarithmic Equations Worksheet
Apr 24, 26 09:05 PM
 Solving Logarithmic Equations Worksheet

