GRAPHING AND WRITING INEQUALITIES
Subscribe to our ▶️ YouTube channel 🔴 for the latest videos, updates, and tips.
An inequality is a statement that two quantities are not equal. The quantities are compared by using one of the following signs :
<
A < B
A is less than B
>
A > B
A is greater than B
≤
A ≤ B
A is less than or equal to B
≥
A ≥ B
A is greater than or equal to B
Solution of an Inequality
A solution of an inequality is any value of the variable that makes the inequality true.
For example, 3 is a solution for the inequality x > 2. Because x is greater then 2, 3 is an acceptable value for x and it makes the inequality true, that is, 3 > 2.
Identifying Solutions of Inequalities
Example 1 :
Describe the solutions of 3 + x < 9 in words.
Solution :
Test values of x that are positive, negative, and 0.
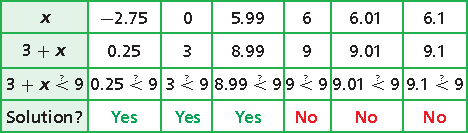
When the value of x is a number less than 6, the value of 3 + x is less than 9.
When the value of x is 6, the value of 3 + x is equal to 9.
When the value of x is a number greater than 6, the value of 3 + x is greater than 9.
The solutions of 3 + x < 9 are numbers less than 6.
Note :
An inequality like 3 + x < 9 has too many solutions to list. You can use a graph on a number line to show all the solutions.
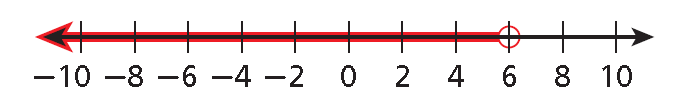
The solutions are shaded and an arrow shows that the solutions continue past those shown on the graph. To show that an endpoint is a solution, draw a solid circle at the number. To show that an endpoint is not a solution, draw an empty circle.
Graphing Inequalities
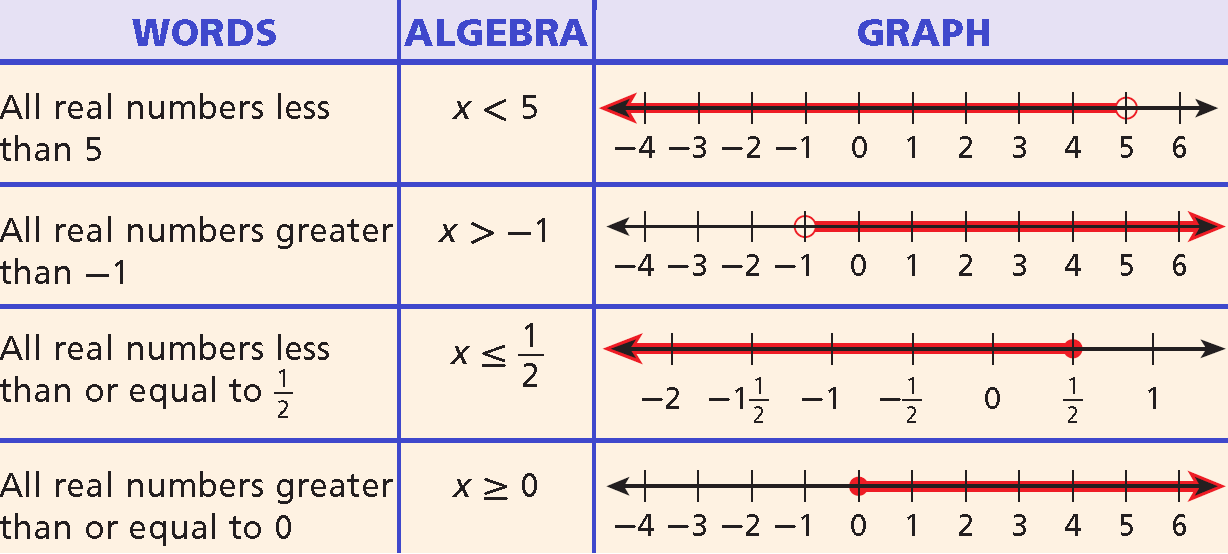
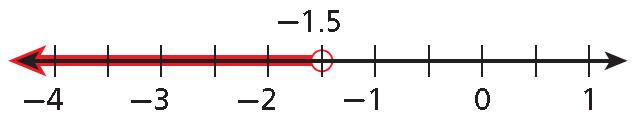
Example 2 :
Graph :
x < -1.5
Solution :
Draw an empty circle at -1.5.
Shade all the numbers less than -1.5 and draw an arrow pointing to the left.
Example 3 :
Graph :
y ≥ 2
Solution :
Draw a solid circle at 2.
Shade all the numbers greater than 2 and draw an arrow pointing to the right.
Writing an Inequality from a Graph
Example 4 :
Write the inequality for the graph shown below.
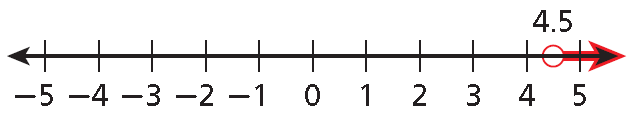
Solution :
Use any variable. The arrow points to the right, so use either > or ≥. The empty circle at 4.5 means that 4.5 is not a solution, so use >.
x > 4.5
Example 5 :
Write the inequality for the graph shown below.
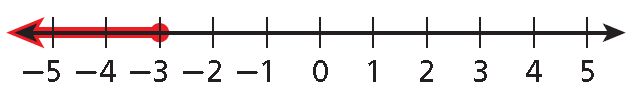
Solution :
Use any variable. The arrow points to the left, so use either < or ≤. The solid circle at -3 means that -3 is a solution, so use ≤.
y ≤ -3
Application Problem
Example 6 :
The members of a lightweight crew team can weigh no more than 165 pounds each. Define a variable and write an inequality for the acceptable weights of the team members. Graph the solutions.
Solution :
Let w represent the weights that are allowed.
Athletes may weigh
no more than
165 pounds.
w
≤
165
w ≤ 165
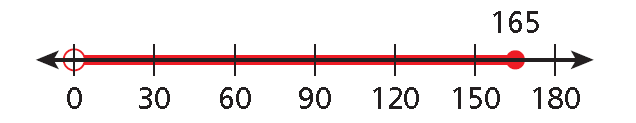
Stop the graph at 0 because a person’s weight must be a positive number.
Subscribe to our ▶️ YouTube channel 🔴 for the latest videos, updates, and tips.
Kindly mail your feedback to v4formath@gmail.com
We always appreciate your feedback.
About Us | Contact Us | Privacy Policy
©All rights reserved. onlinemath4all.com

Recent Articles
-
Digital SAT Math Questions and Answers (Part - 13)
May 10, 26 05:50 PM
 Digital SAT Math Questions and Answers (Part - 13)
 -
Problems on Solving Logarithmic Equations
Apr 24, 26 09:30 PM
Problems on Solving Logarithmic Equations -
Solving Logarithmic Equations Worksheet
Apr 24, 26 09:05 PM
 Solving Logarithmic Equations Worksheet