FINDING INTERQUARTILE RANGE WORKSHEET
Subscribe to our ▶️ YouTube channel 🔴 for the latest videos, updates, and tips.
Problem 1 :
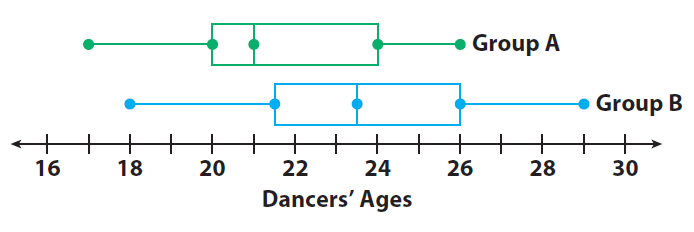
The box plots compare the ages of dancers in two different dance troupes.
(i) Find the interquartile (IQR) for each set of data.
(ii) Compare the IQRs. How do the IQRs describe the distribution of the ages in each group ?
Problem 2 :
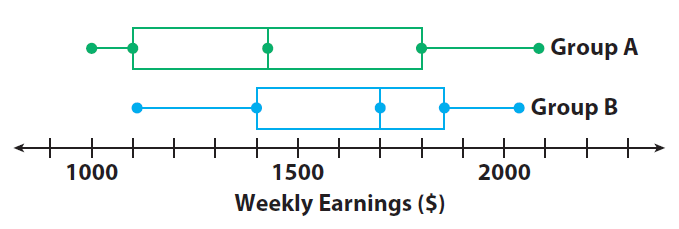
The box plots compare the weekly earnings of two groups of salespeople from different clothing stores.
(i) Find the interquartile (IQR) for each set of data.
(ii) Compare the IQRs. How do the IQRs describe the data set in each group ?
Problem 3 :
The box plots compare the heights 9 (in inches) of two groups of some small plants.
(i) Find the interquartile (IQR) for each set of data.
(ii) Compare the IQRs. How do the IQRs describe the data set in each group ?

Detailed Answer Key
Problem 1 :
The box plots compare the ages of dancers in two different dance troupes.
(i) Find the interquartile (IQR) for each set of data.
(ii) Compare the IQRs. How do the IQRs describe the distribution of the ages in each group ?
Solution :
Finding the IQR for each set of data :
Group A : IQR = Upper quartile − Lower quartile
= 24 − 20
= 4
Group B : IQR = Upper quartile − Lower quartile
= 26 − 21.5
= 4.5
Comparing IQRs :
The IQR of group B is slightly greater than the IQR of group A. The ages in the middle half of group B are slightly more spread out than in group A.
Problem 2 :
The box plots compare the weekly earnings of two groups of salespeople from different clothing stores.
(i) Find the interquartile (IQR) for each set of data.
(ii) Compare the IQRs. How do the IQRs describe the data set in each group ?
Solution :
Finding the IQR for each set of data :
Group A : IQR = Upper quartile − Lower quartile
= 1800 − 1100
= 700
Group B : IQR = Upper quartile − Lower quartile
= 1850 − 1400
= 450
Comparing IQRs :
Group A’s IQR is greater, so the salaries in the middle 50% for group A are more spread out than those for group B.
Problem 3 :
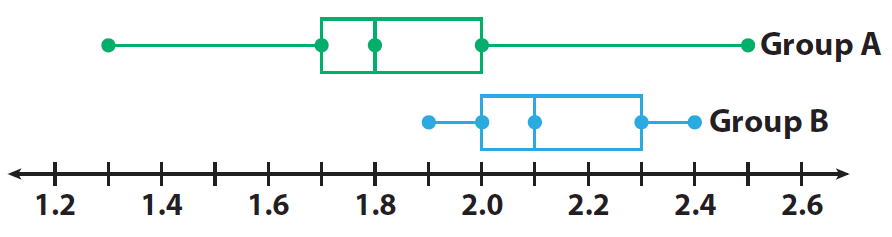
The box plots compare the heights of two groups of some small plants.
(i) Find the interquartile (IQR) for each set of data.
(ii) Compare the IQRs. How do the IQRs describe the data set in each group ?
Solution :
Finding the IQR for each set of data :
Group A : IQR = Upper quartile − Lower quartile
= 2.0 − 1.7
= 0.3
Group B : IQR = Upper quartile − Lower quartile
= 2.3 − 2.0
= 0.3
Comparing IQRs :
The IQRs are the same. The spreads of the middle 50% of the data values are the same for the two data sets.
Subscribe to our ▶️ YouTube channel 🔴 for the latest videos, updates, and tips.
Kindly mail your feedback to v4formath@gmail.com
We always appreciate your feedback.
About Us | Contact Us | Privacy Policy
©All rights reserved. onlinemath4all.com

Recent Articles
-
Digital SAT Math Questions and Answers (Part - 3)
Mar 13, 26 08:41 PM
 Digital SAT Math Questions and Answers (Part - 3)
 -
Digital SAT Math Problems and Solutions (Part - 50)
Mar 13, 26 10:25 AM
 Digital SAT Math Problems and Solutions (Part - 50)
 -
SAT Math Resources (Videos, Concepts, Worksheets and More)
Mar 13, 26 02:08 AM
SAT Math Resources (Videos, Concepts, Worksheets and More)