FINDING FUNCTION VALUES FROM A GRAPH WORKSHEET
Subscribe to our ▶️ YouTube channel 🔴 for the latest videos, updates, and tips.
Question 1 :
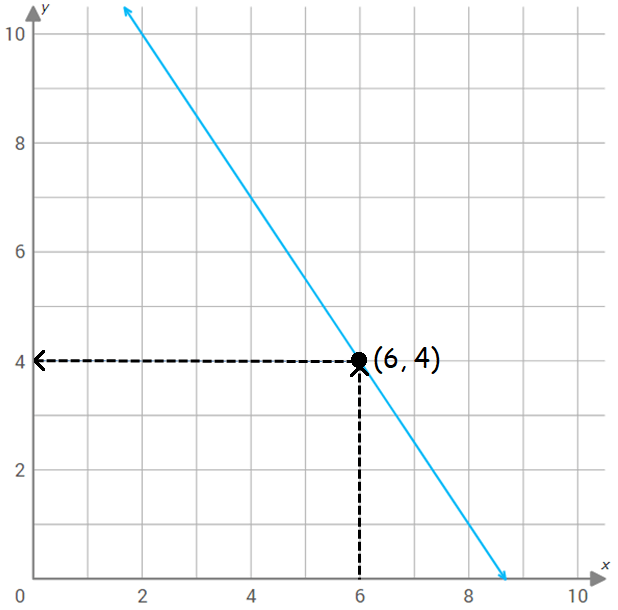
Use the graph of f(x) shown below to find f(6).
Answer 1 :
We have to find value of the function f(x) at x = 6.
Step 1 :
Draw a vertical line through 6 on the x-axis.
Step 2 :
Mark the point of intersection of the vertical line x = 6 and the graph of f(x).
Step 3 :
Draw an horizontal line from the point of intersection to y-axis.
Step 5 :
The horizontal line meets y-axis at 4.
So, the value of the function f(x) at x = 6 is 4.
That is,
f(6) = 4
Question 2 :
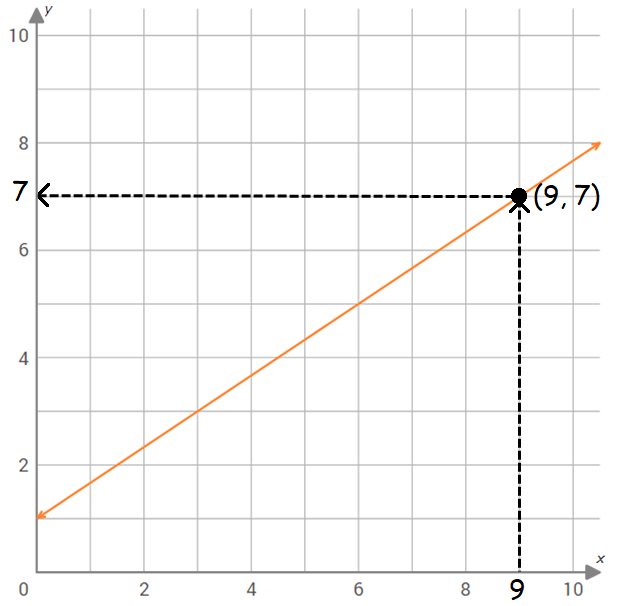
Use the graph of f(x) shown below to find f(9).
Solution :
We have to find value of the function f(x) at x = 9.
Step 1 :
Draw a vertical line through 9 on the x-axis.
Step 2 :
Mark the point of intersection of the vertical line x = 9 and the graph of f(x).
Step 3 :
Draw an horizontal line from the point of intersection to y-axis.
Step 5 :
The horizontal line meets y-axis at 7.
So, the value of the function f(x) at x = 9 is 7.
That is,
f(9) = 7
Question 3 :
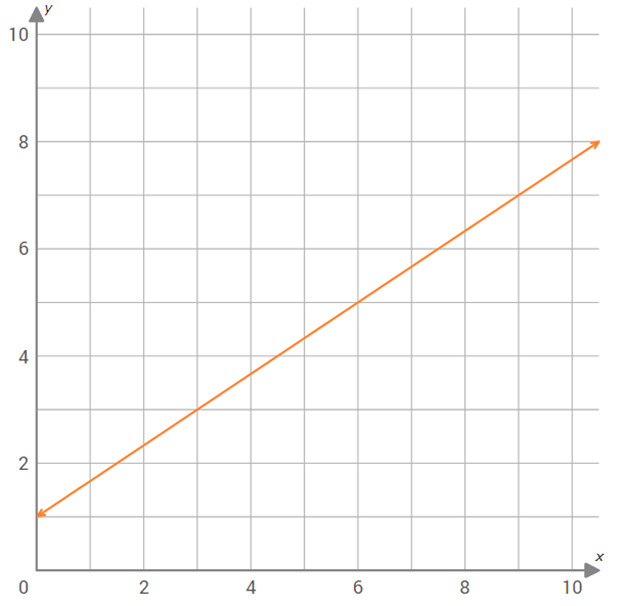
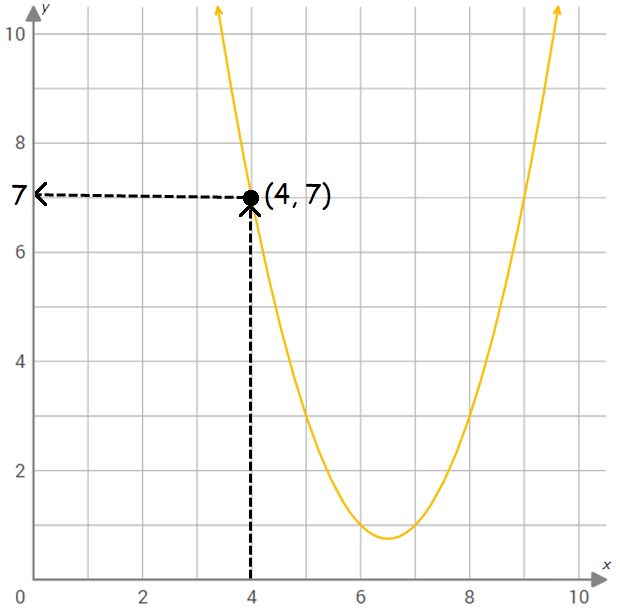
Use the graph of f(x) shown below to find f(4).
Solution :
We have to find value of the function f(x) at x = 4.
Step 1 :
Draw a vertical line through 4 on the x-axis.
Step 2 :
Mark the point of intersection of the vertical line x = 4 and the graph of f(x).
Step 3 :
Draw an horizontal line from the point of intersection to y-axis.
Step 5 :
The horizontal line meets y-axis at 7.
So, the value of the function f(x) at x = 4 is 7.
That is,
f(4) = 7
Question 4 :
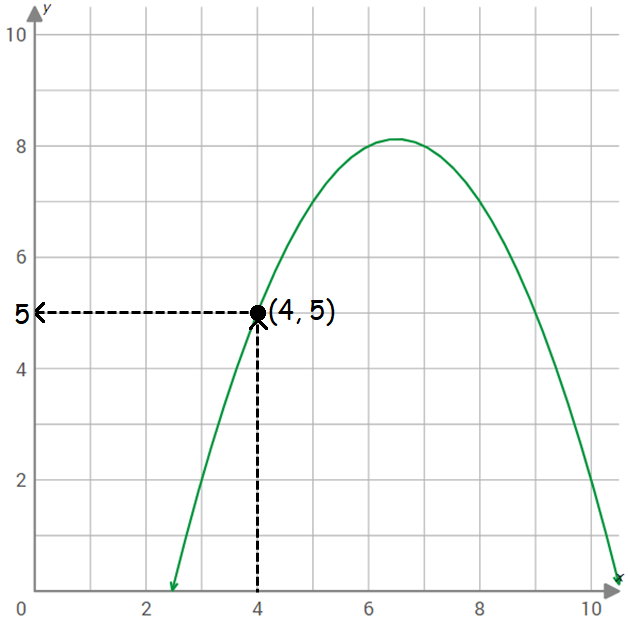
Use the graph of f(x) shown below to find f(4).
Solution :
We have to find value of the function f(x) at x = 4.
Step 1 :
Draw a vertical line through 4 on the x-axis.
Step 2 :
Mark the point of intersection of the vertical line x = 4 and the graph of f(x).
Step 3 :
Draw an horizontal line from the point of intersection to y-axis.
Step 5 :
The horizontal line meets y-axis at 5.
So, the value of the function f(x) at x = 4 is 5.
That is,
f(4) = 5
Question 5 :
The function y = −3x + 12 represents the amount y (in fluid ounces) of juice remaining in a bottle after you take x gulps.
a. Identify the independent and dependent variables.
b. The domain is 0, 1, 2, 3, and 4. What is the range?
Solution :
y = −3x + 12
a. Here x is the independent variable and y is the dependent variable.
b.
|
When x = 0 y = −3(0) + 12 y = 0 + 12 y = 12 |
When x = 1 y = −3(1) + 12 y = -3 + 12 y = 9 |
|
When x = 2 y = −3(2) + 12 y = -6 + 12 y = 6 |
When x = 3 y = −3(3) + 12 y = -9 + 12 y = 3 |
When x = 4
y = −3(4) + 12
y = -12 + 12
y = 0
So, the range is {12, 9, 6, 3, 0}
Question 6 :
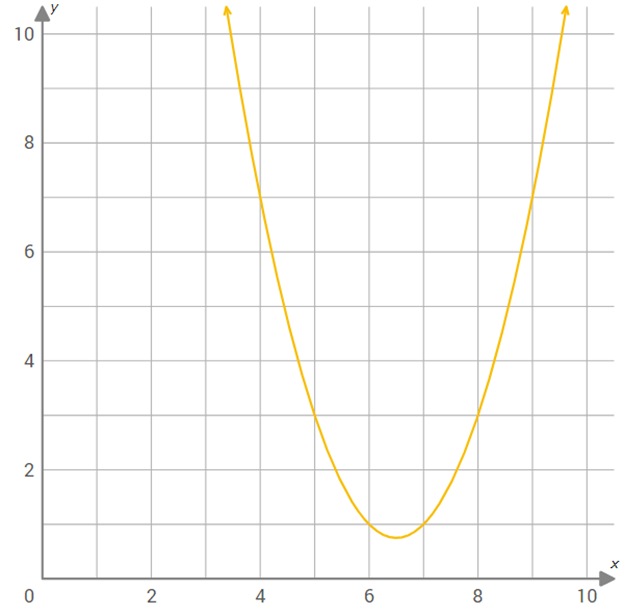
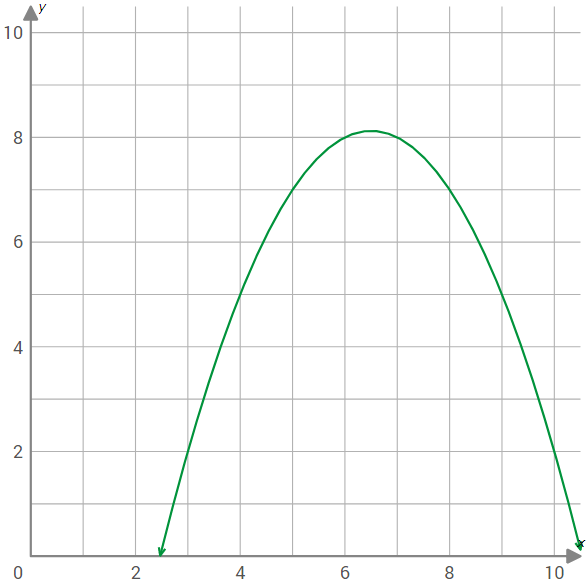
The graph represents the height h of a projectile after t seconds.

a. Explain why h is a function of t.
b. Approximate the height of the projectile after 0.5 second and after 1.25 seconds.
c. Approximate the domain of the function.
d. Is t a function of h? Explain.
Solution :
a) Each input has only one output, then it is a function.
b) Corresponding value of 0.5 is 20
Height of the projectile after 0.5 seconds is 20 ft.
Corresponding value of 1.25 is 29 approximately.
Height of the projectile after 1.25 seconds is 29 ft.
c) Domain is 0 < t < 2.8
d) Yes it is function.
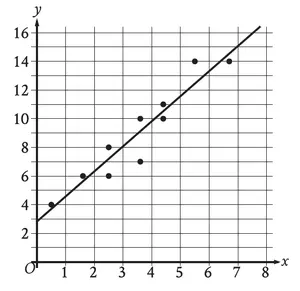
Question 7 :
Find the value of x so that f(x) = 7.

Solution :
When y = 7, x = 5.
Question 8 :
The function C(x) = 17.5x − 10 represents the cost (in dollars) of buying x tickets to the orchestra with a $10 coupon.
a. How much does it cost to buy five tickets?
b. How many tickets can you buy with $130?
Solution :
C(x) = 17.5x − 10
Here x represents number of tickets and C(x) represents total cost of tickets.
a) Cost of five tickets :
x = 5
C(5) = 17.5(5) − 10
= 87.5 - 10
= 77.5
b) When C(x) = 130
130 = 17.5x − 10
130 + 10 = 17.5x
140 = 17.5x
x = 140/17.5
x = 8
So, the required number of tickets is 8.
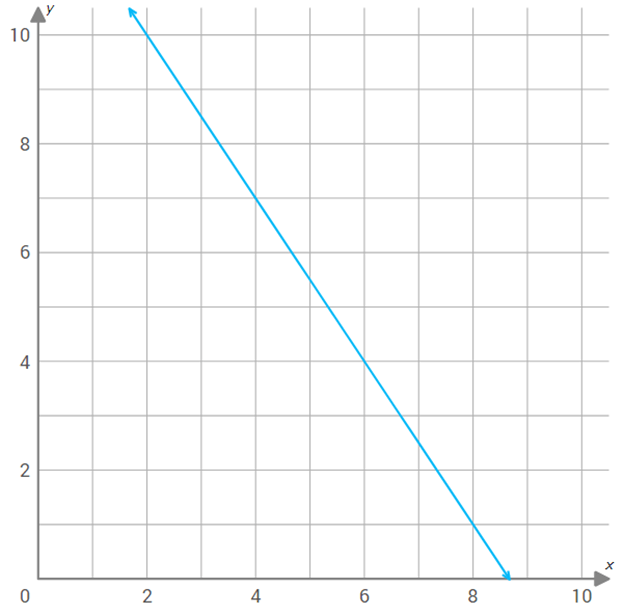
Question 9 :
Find the zero of the function f (x) = 2x + 8.
Solution :
The other names of zero is x-intercept. To find the x-intercept from graph, we have to check the point of intersection of graph on the x-axis.
To find zero of the function, we have to apply f(x) = 0
2x + 8 = 0
2x = -8
x = -8/2
x = -4
Subscribe to our ▶️ YouTube channel 🔴 for the latest videos, updates, and tips.
Kindly mail your feedback to v4formath@gmail.com
We always appreciate your feedback.
About Us | Contact Us | Privacy Policy
©All rights reserved. onlinemath4all.com

Recent Articles
-
Digital SAT Math Problems and Solutions (Part -27)
Feb 28, 26 07:46 PM
 Digital SAT Math Problems and Solutions (Part -27)
 -
Digital SAT Math Problems and Solutions (Part - 26)
Feb 28, 26 06:28 PM
 Digital SAT Math Problems and Solutions (Part - 26)
 -
Digital SAT Math Problems and Solutions (Part - 25)
Feb 28, 26 07:21 AM
 Digital SAT Math Problems and Solutions (Part - 25)