DRAWING FREQUENCY POLYGONS WORKSHEET
Subscribe to our ▶️ YouTube channel 🔴 for the latest videos, updates, and tips.
Draw a frequency polygon for the given data without using histogram.
Problem 1 :
|
Class interval 10 - 20 20 - 30 30 - 40 40 - 50 50 - 60 60 - 70 70 - 80 80 - 90 |
Frequency 4 6 8 10 12 14 7 5 |
1. Answer :
|
Class interval 0 - 10 10 - 20 20 - 30 30 - 40 40 - 50 50 - 60 60 - 70 70 - 80 80 - 90 90 - 100 |
Mid points 5 15 25 35 45 55 65 75 85 95 |
Frequency 0 4 6 8 10 12 14 7 5 0 |
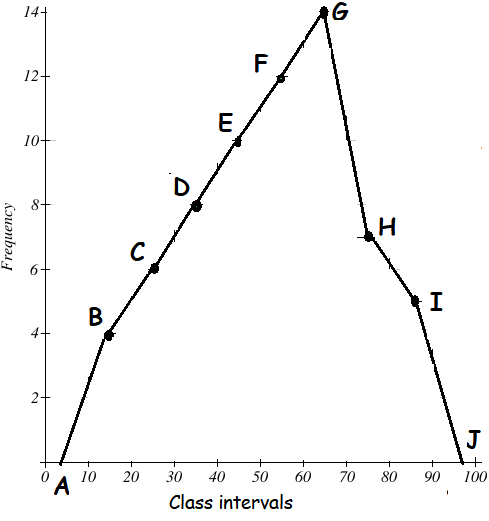
Mark the class intervals along the X-axis and the frequency along the Y-axis. We take the imagined classes 0-10 at the beginning and 90-100 at the end, each with frequency zero. We have tabulated the data as shown.
Using the adjacent table, plot the points A (5, 0), B (15, 4), C (25, 6), D (35, 8), E (45, 10), F (55, 12), G (65, 14), H (75, 7), I (85, 5) and J (95, 0).
We draw the line segments AB, BC, CD, DE, EF, FG, GH, HI, IJ to obtain the required frequency polygon ABCDEFGHIJ, which is shown in the picture given below.
Scale :
X - axis 1 cm = 10 units
Y - axis 1 cm = 2 units
Problem 2 :
|
Age (in years) 0 - 10 10 - 20 20 - 30 30 - 40 40 - 50 50 - 60 60 - 70 |
Number of persons 6 11 25 35 18 12 6 |
Solution :
|
Class interval 0 - 10 10 - 20 20 - 30 30 - 40 40 - 50 50 - 60 60 - 70 70 - 80 |
Mid points 5 15 25 35 45 55 65 75 |
Frequency 6 11 25 35 18 12 6 0 |
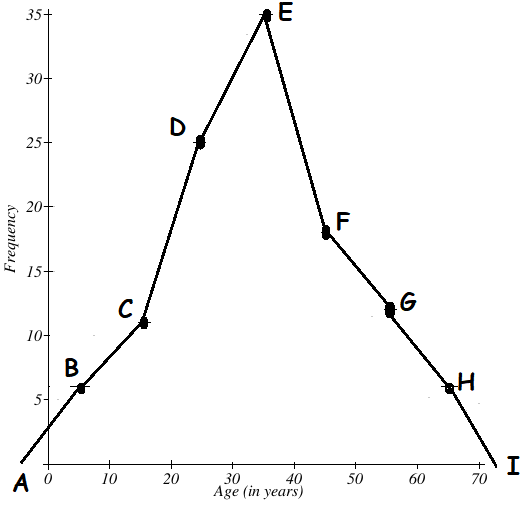
Mark the class intervals along the X-axis and the frequency along the Y-axis. We take the imagined classes 0-10 at the beginning and 60-70 at the end, each with frequency zero. We have tabulated the data as shown.
Using the adjacent table, plot the points A (5, 6), B (15, 11), C (25, 25), D (35, 35), E (45, 18), F (55, 12), G (65, 6), and H (75, 0)
We draw the line segments AB, BC, CD, DE, EF, FG, GH, HI to obtain the required frequency polygon ABCDEFGHI, which is shown in the picture given below.
Scale :
X - axis 1 cm = 10 units
Y - axis 1 cm = 5 units
Problem 3 :
Henry surveyed 50 people. This frequency polygon shows their shoe sizes
(a) What is the modal shoe size?
(b) What is the range of the shoe sizes?
(c) What fraction of the people surveyed have size 5 shoes?
(d) What percentage of the people surveyed have size 7 shoes?
(e) Henry picks somebody at random to win a prize. Write down the probability that the winner has size 6 shoes.

Solution :
(a) By observing the points (0, 4) (5, 12) (6, 15) (7, 10) (8, 5) and (9, 1).
The modal class in statistics is the class interval with the highest frequency in a grouped frequency distribution. The modal class for the given data is 6.
(b) Range = greatest value - least value
|
Shoe size 4 5 6 7 8 9 |
Frequency 4 17 15 10 5 1 |
= 9 - 4
= 5
(c) 17 students has their show size as 5.
Total = 4 + 17 + 15 + 10 + 5 + 1
= 52
Fraction of people surveyed with the size of 5 = 17/52
(d) 10 students has their show size as 7.
Fraction of people surveyed with the size of 7 = 10/52
= 5/26
(e) Number of people who uses the shoe size of 6 = 15
Total number of people who uses sizes from 4 to 9
= 52
Required probability = 15/52
Problem 4 :
Roy is a striker for Rovers. The frequency polygon shows the number of goals scored in each game over 20 games he has played.
(a) Work out the median number of goals scored per game.
(b) Work out the mean number of goals scored per game.
(c) A journalist asks him for the “average” number of goals scored per game. Which average should he use?

Solution :
|
Goals scored |
Frequency |
Cumulative frequency |
|
0 1 2 3 4 5 |
6 8 2 1 2 1 |
6 6 + 8 = 14 14 + 2 = 16 16 + 1 = 17 17 + 2 = 19 19 + 1 = 20 |
a) Median = 20/2
= 10th value is the median.
1 is the median.
b) Mean
= [0(6) + 1(8) + 2(2) + 3(1) + 4(2) + 5(1)]/(6+8+2+1+2+1)
= (0+8+4+3+8+5)/20
= 28/20
= 1.4
c) Consider the characteristics of the mean and median. The mean is sensitive to outliers, while the median is more robust.
In this case, the median (1 goal) provides a more representative "average" as it is less affected by the few games with higher goal counts than the mean (1.4 goals).
Problem 5 :
The frequency polygon shows information on how long people spend in a swimming pool.

Calculate an estimate of the mean time spent in the swimming pool.
Solution :
|
Time 10 30 50 70 90 |
Frequency 5 20 15 25 1 |
Total time taken
= [10(5) + 30(20) + 50(15) + 70(25) + 90(1)]
= 50 + 600 + 750 + 1750 + 90
= 3240
Total frequency = 5 + 20 + 15 + 25 + 1
= 66
Mean = 3240/66
= 49.09
Approximately 49.1
Subscribe to our ▶️ YouTube channel 🔴 for the latest videos, updates, and tips.
Kindly mail your feedback to v4formath@gmail.com
We always appreciate your feedback.
About Us | Contact Us | Privacy Policy
©All rights reserved. onlinemath4all.com

Recent Articles
-
Digital SAT Math Questions and Answers (Part - 13)
May 10, 26 05:50 PM
 Digital SAT Math Questions and Answers (Part - 13)
 -
Problems on Solving Logarithmic Equations
Apr 24, 26 09:30 PM
Problems on Solving Logarithmic Equations -
Solving Logarithmic Equations Worksheet
Apr 24, 26 09:05 PM
 Solving Logarithmic Equations Worksheet