SKETCHING THE GIVEN CURVE PRACTICE PROBLEMS
Subscribe to our ▶️ YouTube channel 🔴 for the latest videos, updates, and tips.
When we are sketching the graph of functions either by hand or through any graphing software we cannot show the entire graph. Only a part of the graph can be sketched.
A crucial question is which part of the curve we need to show and how to decide that part. To decide on this we use the derivatives of functions. We enlist few guidelines for determining a good viewing rectangle for the graph of a function. They are :
(i) The domain and the range of the function.
(ii) The intercepts of the cure (if any).
(iii) Critical points of the function.
(iv) Local extrema of the function.
(v) Intervals of concavity.
(vi) Points of inflections (if any).
(vii) Asymptotes of the curve (if exists)
Sketch the graphs of the following functions.
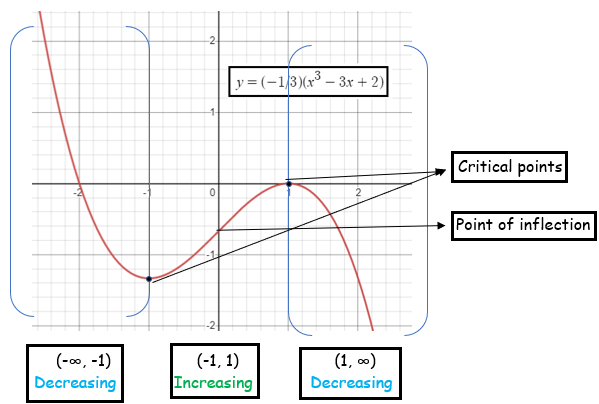
(i) y = (-1/3)(x3 - 3x + 2) Solution
For each problem, find the: x and y intercepts, x-coordinates of the critical points, open intervals where the function is increasing and decreasing, x-coordinates of the inflection points, open intervals where the function is concave up and concave down, and relative minima and maxima. Using this information, sketch the graph of the function.
Problem 2 :
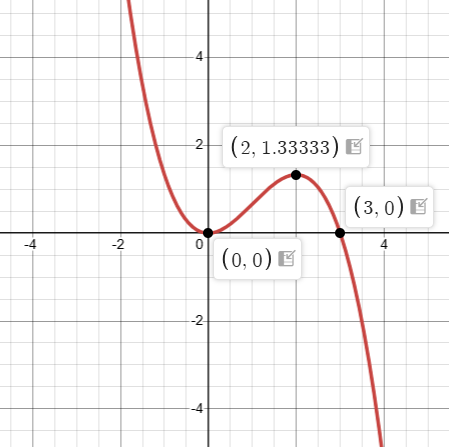
f(x) = -x3/3 + x2
Problem 3 :
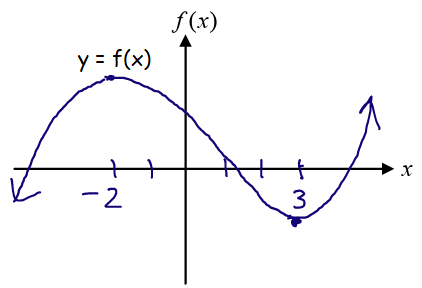
Sketch the graph of the function f(x) that satisfies f'(x) > 0 for x < -2 and x > 3 and f'(x) < 0 for -2 < x < 3
Problem 4 :
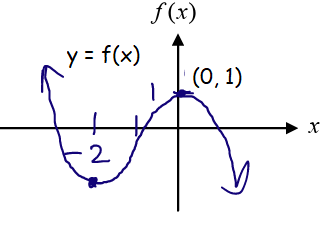
Sketch the graph of f(x), assuming f(0) = 1 and given the graph of the derivative f'(x).
Answer Key
1)
Since it is a polynomial function, all real values are domain and range.
1 and -2 are x-intercepts.
y-intercept is y = -2/3
Critical points are x = -1, 1
Decreasing on (-∞, -1) and (1, ∞).
Increasing on (-1, 1)
local extrema :
f''(-1) = 2 > 0 (Minimum)
f''(1) = -2 < 0 (Maximum)
Concavity :
At (-∞, 0), concave up
At (0, ∞), concave down
Point of inflection :
point of inflection is (0, -2/3).
It will have only slant asymptote.
2) Critical numbers are 0 and 2.
Decreasing on (-∞, 0)
increasing on (0, 2)
Decreasing on (2, ∞)
Concave up on (-∞, 1), Concave down on (1, ∞)
Point of inflection at x = 1
maximum at (2, 4/3).
3) At x < -2 increasing
at -2 < x < 3 decreasing
At x > 3 increasing.
4) At x < -2 decreasing
At -2 < x < 0 increasing
At x > 0 decreasing
Identify the domain and range of each. Then sketch the graph.
Problem 1 :
y = x√(4 - x) Solution
Problem 2 :
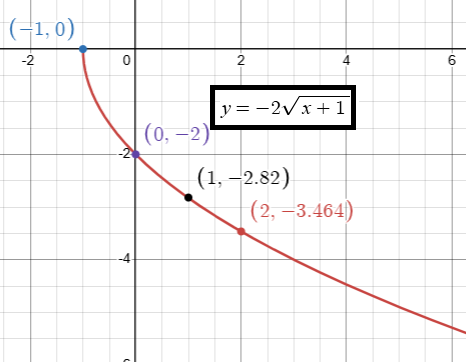
y = -2√(x + 1)
How would each of the following graphs change in relation to the parent graph?
Problem 3 :
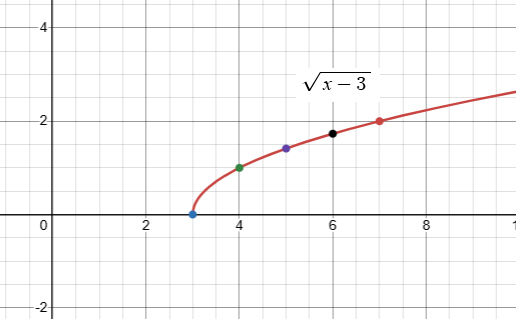
y = √(x - 3)
Problem 4 :
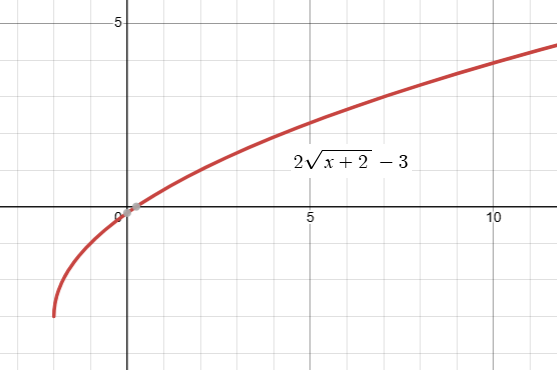
y = 2√(x + 2) - 3
Answer Key
1) Possible values of x are (-∞, 3) ==> Domain
y values are (-∞, 4) ==> Range
x intercepts are 0 and 4.
y-intercept is at y = 0
At (-∞, 8/3) increasing
At (8/3, ∞) decreasing.
the maximum point is (8/3, 16/3√3).
There is no point of inflection.
As x ->∞, y -> ±∞

2) Possible values of x are (-1, ∞) ==> Domain
y values are (0, -∞) ==> Range
Intercepts :
x intercept is at x = -1.
y-intercept :
y = -2
Comparing with y = a√(x - h) + k,
we get move the graph of parent function 1 unit to the left and there is no vertical translation.
Reflection about x-axis and 2 units of vertical stretch.
By applying some inputs, we will get the outputs.
y = -2√(x + 1)
3) Domain and range :
Possible values of x are (3, ∞) ==> Domain
y values are (0, ∞) ==> Range
Intercepts :
x intercept is at x = 3.
y-intercept :
There is no y-intercept
Comparing with y = a√(x - h) + k,
we get move the graph of parent function should be moved 3 units to the right.
y = √(x - 3)
4)
Domain and range :
Possible values of x are (2, ∞) ==> Domain
y values are (0, ∞) ==> Range
Intercepts :
x intercept is at x = 1/4
y-intercept :
y-intercept is (0, -0.172)
Comparing with y = a√(x - h) + k,
we get move the graph of parent function,
- Vertical stretch of 2 units
- Moving the graph 2 units left
- Moving the graph 3 units down.
Sketch the graphs of the following functions.
Problem 1 :
y = (x2+1)/(x2-4)
Problem 2 :
y = 1/(1+e-x)
Problem 3 :
y = x3/24 - log x
Problem 4 :
State each discontinuity, 𝑥-intercept, and 𝑦-intercept. Then sketch a graph.
f(x) = (x2 - 4)/(x - 2)
Problem 5 :
State each discontinuity, 𝑥-intercept, and 𝑦-intercept. Then sketch a graph.
f(x) = -2/(x - 3)2
Subscribe to our ▶️ YouTube channel 🔴 for the latest videos, updates, and tips.
Kindly mail your feedback to v4formath@gmail.com
We always appreciate your feedback.
About Us | Contact Us | Privacy Policy
©All rights reserved. onlinemath4all.com

Recent Articles
-
SAT Math Problems on Exponents and Radicals
Feb 21, 26 08:28 PM
SAT Math Problems on Exponents and Radicals -
SAT Math Problems on Angles
Feb 21, 26 08:20 PM
SAT Math Problems on Angles -
Digital SAT Math Problems and Solutions (Part - 9)
Feb 21, 26 10:41 AM
Digital SAT Math Problems and Solutions (Part - 9)

