MAKING INFERENCES FROM A RANDOM SAMPLE
Subscribe to our ▶️ YouTube channel 🔴 for the latest videos, updates, and tips.
After obtaining a random sample of a population, we can make inferences about the population from the sample using dot plot, box plot and proportion.
Example 1 :
Rosee asked students on the lunch line how many books they had in their backpacks. She recorded the data as a list: 2, 6, 1, 0, 4, 1, 4, 2, 2.
(i) Make a dot plot for the books carried by this sample of students.
Step 1 :
Make a real number line.
In the given data, we have values range from from 0 to 6.
So we have to use a scale from 0 to 6.
Step 2 :
Place a dot above each number on the number line for each time it appears in the data set.

(ii) How are the number of dots you plotted related to the number of data values ?
They are the same. Each dot represents one data value.
(iii) What could Rosee do to improve the quality of her data ?
Rosee could increase the size of her sample.
Example 2 :
The number of pets owned by a random sample of students at Park Middle school is shown below.
9, 2, 0, 4, 6, 3, 3, 2, 5
(i) Use the data to make a box plot.
Step 1 :
Order the data from least to greatest. Then find the least and greatest values, the median, and the lower and upper quartiles.
Step 2 :
The lower and upper quartiles can be calculated by finding the medians of each “half” of the number line that includes all the data.
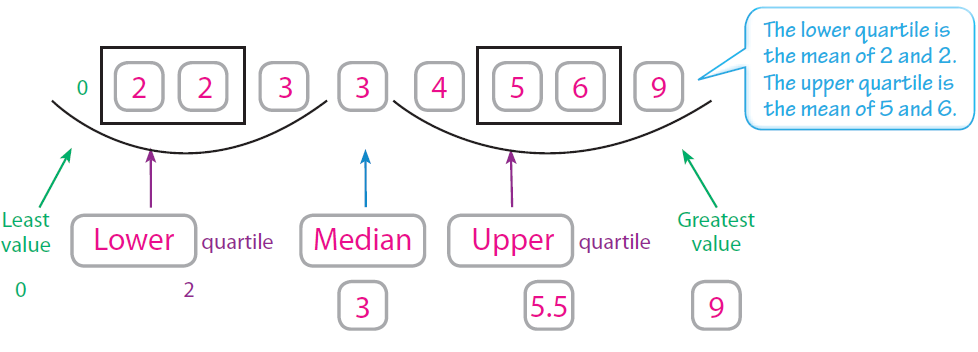
Step 3 :
Draw a number line that includes all the data values.
Plot a point for each of the values found in Step 1.
Draw a box from the lower to upper quartile. Inside the box, draw a vertical line through the median. Finally, draw the whiskers by connecting the least and greatest values to the box.

(ii) What is a good measure for the most likely number of pets ?
A good measure for the most likely number of pets is 3.
(iii) How many pets does every student have ?
Almost every student in Parkview has at least 1 pet.
Example 3 :
A shipment to a warehouse consists of 3,500 MP3 players. The manager chooses a random sample of 50 MP3 players and finds that 3 are defective. How many MP3 players in the shipment are likely to be defective ?
Solution :
It is reasonable to make a prediction about the population, because this sample is random.
Step 1 :
Set up a proportion.
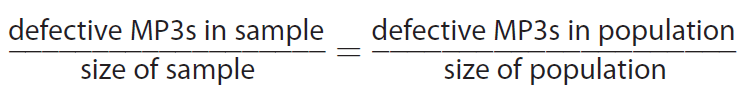
Step 2 :
Substitute values into the proportion.
Substitute known values. Let x be the number of defective MP3 players in the population.
3 / 50 = x / 3500
50 x 70 = 3500, so multiply the numerator and denominator of the fraction 3/50 by 70.
(3x70) / (50x70) = x / 3500
210 / 3500 = x / 3500
210 = x
Based on the sample, you can predict that 210 MP3 players in the shipment would be defective.
Example 4 :
A manager samples the receipts of every fifth person who goes through the line. Out of 50 people, 4 had a mispriced item. If 600 people go to this store each day, how many people can we expect to have a mispriced item ?
Solution :
Step 1 :
Set up a proportion.
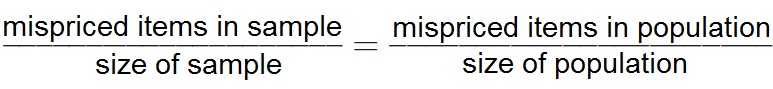
Step 2 :
Substitute values into the proportion.
Substitute known values. Let x be the number of mispriced items in the population.
4 / 50 = x / 600
50 x 12 = 600, so multiply the numerator and denominator of the fraction 4/50 by 12.
(4x12) / (50x12) = x / 600
48 / 600 = x / 600
48 = x
Based on the sample, we can expect 48 mispriced items in the population of 600 people.
Subscribe to our ▶️ YouTube channel 🔴 for the latest videos, updates, and tips.
Kindly mail your feedback to v4formath@gmail.com
We always appreciate your feedback.
About Us | Contact Us | Privacy Policy
©All rights reserved. onlinemath4all.com

Recent Articles
-
Digital SAT Math Questions and Answers (Part - 13)
May 10, 26 05:50 PM
 Digital SAT Math Questions and Answers (Part - 13)
 -
Problems on Solving Logarithmic Equations
Apr 24, 26 09:30 PM
Problems on Solving Logarithmic Equations -
Solving Logarithmic Equations Worksheet
Apr 24, 26 09:05 PM
 Solving Logarithmic Equations Worksheet