HOW TO FIND INTERQUARTILE RANGE FOR UNGROUPED DATA
Subscribe to our ▶️ YouTube channel 🔴 for the latest videos, updates, and tips.
The interquartile range is the range of the middle half (50%) of the data.
Interquartile range = Upper quartile - lower quartile
The data set is that divided into quarters by the lower quartile (Q1), the median (Q2) and the upper quartile (Q3).
So, interquartile range (IQR) = Q3 - Q1
Example 1 :
For the data set 7, 3, 4, 2, 5, 6, 7, 5, 5, 9, 3, 8, 3, 5, 6
(a) Median (b) Lower quartile
(c) Upper quartile (d) Interquartile range
Solution :
7, 3, 4, 2, 5, 6, 7, 5, 5, 9, 3, 8, 3, 5, 6
Number of elements = 15 (odd)
To find median, arrange the data set from least to greatest.
2, 3, 3, 3, 4, 5, 5, 5, 5, 6, 6, 7, 7, 8, 9
Median = (n+1) /2 th element
= (15+1) /2 th element
= 8th element
(a) Median (Q2) = 8th element
Median (Q2) = 5
(b) 2, 3, 3, 3, 4, 5, 5
Lower quartile (Q1) = 5
(c) 5, 6, 6, 7, 7, 8, 9
Upper quartile (Q3) = 7
(d) Inter quartile range = Q3 - Q3
= 7 - 5
= 2
So, the interquartile range is 2.
For the data set given below, find the following.
(a) median (b) lower quartile
(c) upper quartile (d) interquartile range.
Example 2 :
6, 10, 7, 8, 13, 7, 10, 8, 1, 7, 5, 4, 9, 4, 2, 5, 9, 6, 3, 2
Solution :
1, 2, 2, 3, 4, 4, 5, 5, 6, 6, 7, 7, 7, 8, 8, 9, 9, 10, 10, 13
Number of data values = 20 (even)
median = {(n/2)th term + [(n/2) + 1]th term}/2
= (10th term + 11th term)/2
= (6+7)/2
= 13/2
= 6.5
1, 2, 2, 3, 4, 4, 5, 5, 6, 6, 7, 7, 7, 8, 8, 9, 9, 10, 10, 13
(b) Lower quartile (Q1) = 4
(c) Upper quartile (Q3) = 9
(d) Interquartile range = 9-4 ==> 5
Example 3 :
6, 4, 7, 5, 3, 4, 2, 6, 5, 7, 5, 3, 8, 9, 3, 6, 5
Solution :
2, 3, 3, 3, 4, 4, 5, 5, 5, 5, 6, 6, 6, 7, 7, 8, 9
Number of data values = 17 (odd)
median = (n + 1)/2th term
= (17 + 1)/2th term
= (18/2)th term
= 9th term
median = 5
2, 3, 3, 3, 4, 4, 5, 5, 5, 5, 6, 6, 6, 7, 7, 8, 9
(b) Lower quartile (Q1) = (3 + 4)/2 ==> 3.5
(c) Upper quartile (Q3) = (6 + 7)/2 ==> 6.5
(d) Interquartile range = Q3 - Q1
= 6.5 - 3.5
= 3
Example 4 :
11, 6, 7, 8, 13, 10, 8, 7, 5, 2, 9, 4, 4, 5, 8, 2, 3, 6
Solution :
11, 6, 7, 8, 13, 10, 8, 7, 5, 2, 9, 4, 4, 5, 8, 2, 3, 6
Arranging from least to greatest,
2, 2, 3, 4, 4, 5, 5, 6, 6, 7, 7, 8, 8, 8, 9, 10, 11, 13
Number of data values = 18 (even)
= {(n/2)th term + [(n/2) + 1]th term}/2
= (9th term + 10th term)/2
= (6 + 7)/2
= 13/2
median = 6.5
2, 2, 3, 4, 4, 5, 5, 6, 6, 7, 7, 8, 8, 8, 9, 10, 11, 13
(b) Lower quartile (Q1) = (4 + 4)/2 ==> 4
(c) Upper quartile (Q3) = (8 + 9)/2 ==> 8.5
(d) Interquartile range = Q3 - Q1
= 8.5 - 4
= 4.5
Example 5 :

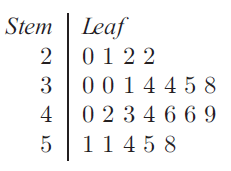
for the data set given, find
|
a) the minimum value b) the median c) the maximum value d) the upper quartile |
e) the lower quartile f) the interquartile range g) the range |
Solution :
20, 21, 22, 22, 30, 30, 31, 34, 34, 35, 38, 40, 42, 43, 44, 46, 46, 49, 51, 51, 54, 55, 58
a) The minimum value = 20
b) The median :
Total number of terms = 23 (odd)
= (23 + 1)/2
= 24/2th value
= 12th value
= 40 is the median
c) The maximum value = 58
d) The upper quartile :
20, 21, 22, 22, 30, 30, 31, 34, 34, 35, 38, 40, 42, 43, 44, 46, 46, 49, 51, 51, 54, 55, 58
The upper quartile = 40
Median of upper part :
20, 21, 22, 22, 30, 30, 31, 34, 34, 35, 38
Q1 = 30
e) Median of lower part :
42, 43, 44, 46, 46, 49, 51, 51, 54, 55, 58
Q3 = 49
Lower quartile = 49
f) range = maximum value - minimum value
= 49 - 30
= 19
Example 6 :
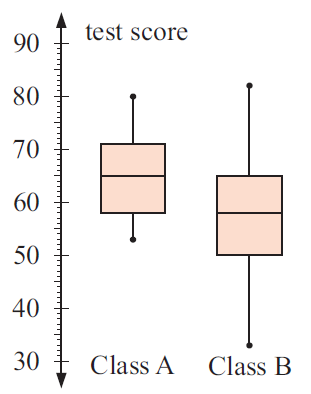
Two classes have completed the same test. Box lots have been drawn to summaries and display the results. They have been on the same set of axes so that the results can be compared.

In which class was.
a) highest mark
b) the lowest mark.
c) the range of marks in class B
d) the interquartile range of class A.
Solution :
a)
Highest mark in class A = 80
class B = 83
b)
lowest mark in class A = 52
in class B = 33
c) Range in class B = 83 - 33
= 50
d) interquartile range of class A =
Q1 = 58 and Q3 = 71
= 71 - 58
= 13
Related Pages
- More examples on find upper lower quartile and range
- Practice problems on median, lower quartile, upper quartile and range
Subscribe to our ▶️ YouTube channel 🔴 for the latest videos, updates, and tips.
Kindly mail your feedback to v4formath@gmail.com
We always appreciate your feedback.
About Us | Contact Us | Privacy Policy
©All rights reserved. onlinemath4all.com

Recent Articles
-
SAT Math Practice Hard Questions
Feb 16, 26 08:56 AM
SAT Math Practice Hard Questions -
SAT Math Preparation with Hard Questions
Feb 16, 26 08:15 AM
SAT Math Preparation with Hard Questions -
SAT Math Practice Problems with Answers
Feb 16, 26 07:53 AM
SAT Math Practice Problems with Answers

