GRAPHING SYSTEMS OF INEQUALITIES
Subscribe to our ▶️ YouTube channel 🔴 for the latest videos, updates, and tips.
To obtain the common region for both given linear inequalities, we have to follow the steps given below.
Step 1 :
First, we have to assume the given inequalities as equations.
Then, we have to draw the graph of the line using x and y-intercepts.
Step 2 :
Take a point on either sides of the line, and substitute into the inequality and verify whether the inequality is satisfied by the points.
We have to shade the region from where the point is taken and it has satisfied the inequality.
Step 3 :
Do the process explained in step 2 for the second inequality.
Step 4 :
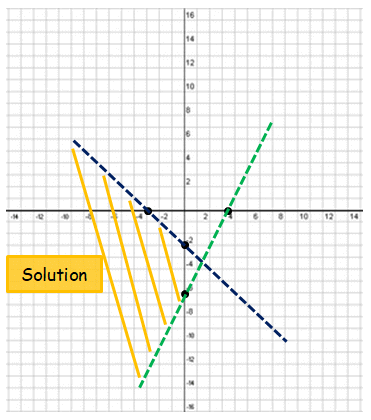
The region that is common to both the shaded portions is the solution to the system of inequalities.
Graph the system of linear inequalities.
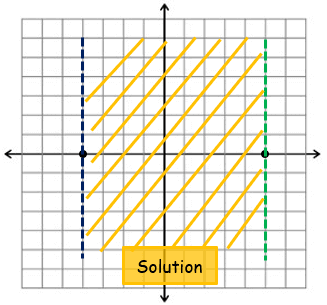
Example 1 :
x < 5
x > -4
Solution :
Given,
x < 5 and x > -4
x = 5 and x = -4
By plotting the x values on the graph, we get
If x = -3, then -3 > -4 (True)
So, we can shade the region which is right to x > -4
If x = 4, then 4 < 5 (True)
So, we can shade the region which is left to x < 5.
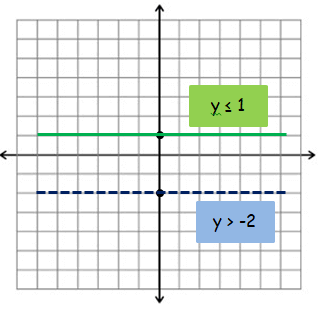
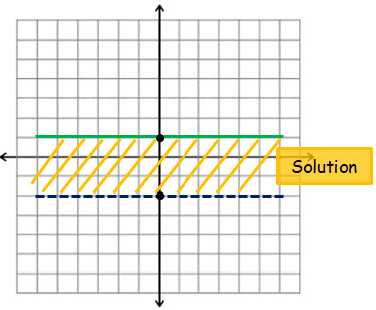
Example 2 :
y > -2
y ≤ 1
Solution :
Given,
y > -2 and y ≤ 1
y = -2 and y = 1
By plotting the y values on the graph, we get
If y = 0, then 0 ≤ 1 (True)
So, we can shade the region which is below to y ≤ 1
If y = 0, then 0 > -2 (True)
So, we can shade the region which is above to y > -2.
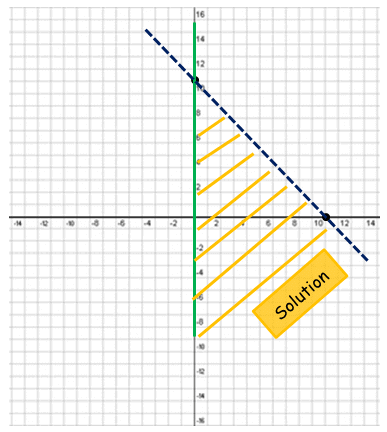
Example 3 :
x ≥ 0
x + y < 11
Solution :
Given,
x ≥ 0, and x + y < 11
x = 0
x + y = 11
To graph the line x + y = 11, we find x and y intercepts.
|
x-intercept : Put y = 0 x + 0 = 11 x = 11 |
y-intercept : Put x = 0 0 + y = 11 y = 11 |
The point on the line x + y = 11 are (11, 0) and (0, 11)
By plotting the points on the graph, we get
If x = 0, then 2 ≥ 0 (True)
So, we can shade the region which is right to x ≥ 1
If x = 5 and y = 2, then 5 + 2 < 11 (True)
So, we can shade the region which is below to x + y < 11.
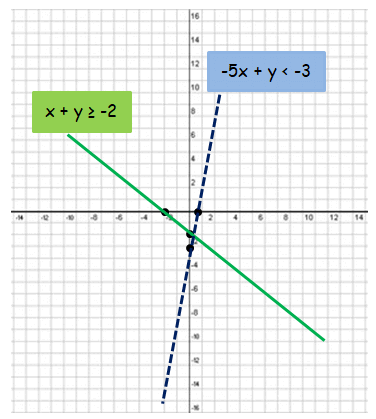
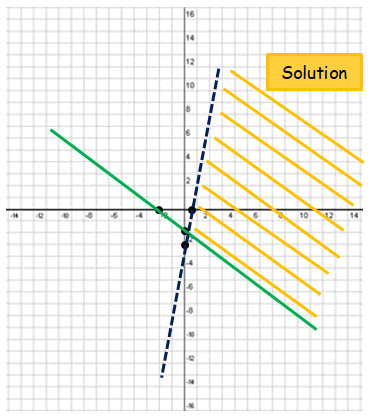
Example 4 :
x + y ≥ -2
-5x + y < -3
Solution :
Given,
x + y ≥ -2 and -5x + y < -3
Converting the inequalities into equations.
x + y = -2 and -5x + y = -3
To graph the line x + y = -2, we find x and y intercepts.
|
x-intercept : Put y = 0 x + 0 = -2 x = -2 |
y-intercept : Put x = 0 0 + y = -2 y = -2 |
To graph the line -5x + y = -3, we find x and y intercepts.
|
x-intercept : Put y = 0 -5x + 0 = -3 x = 3/5 |
y-intercept : Put x = 0 0 + y = -3 y = -3 |
The point on the line x + y = -2 are (-2, 0) and (0, -2)
The point on the line -5x + y = -3 are (3/5, 0) and (0, -3)
By plotting the points on the graph, we get
If x = 0 and y = -1, then 0 - 1 ≥ -2 (True)
So, we can shade the region which is above to x + y ≥ -2
If x = 2 and y = -1, then -5(2) - 1 < -3 (True)
So, we can shade the region which is right to -5x + y < -3.
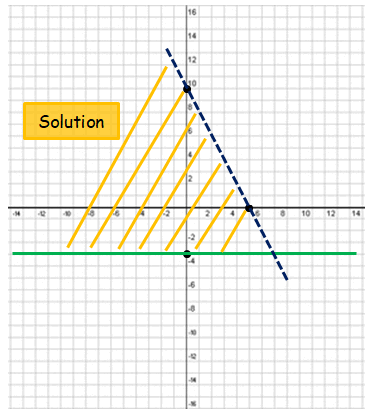
Example 5 :
y ≥ -4
y < -2x + 10
Solution :
Given,
y ≥ -4 and y < -2x + 10
Converting the inequalities into equations.
y = -4 and y = -2x + 10
To graph the line y = -2x + 10, we find x and y intercepts.
|
x-intercept : Put y = 0 0 = -2x + 10 x = 5 |
y-intercept : Put x = 0 y = -2(0) + 10 y = 10 |
The point on the line y = -2x + 10 are (5, 0) and (0, 10)
By plotting the points on the graph, we get

If y = -1, then -1 ≥ -4 (True)
So, we can shade the region which is above to y ≥ -4
If x = 2 and y = 2, then 2 < -2(2) + 10 (True)
So, we can shade the region which is below to y < -2x + 10.
Example 6 :
y > 2x - 7
4x + 4y < -12
Solution :
Given,
y > 2x – 7 and 4x + 4y < -12
y = 2x - 7 and 4x + 4y = -12
To graph the line y = 2x - 7, we find x and y intercepts.
|
x-intercept : Put y = 0 0 = 2x - 7 x = 7/2 |
y-intercept : Put x = 0 y = 2(0) - 7 y = -7 |
To graph the line 4x + 4y = -12 , we find x and y intercepts.
|
x-intercept : Put y = 0 4x + 4(0) = -12 x = -3 |
y-intercept : Put x = 0 4(0) + 4y = -12 y = -3 |
The point on the line y = 2x - 7 are (7/2, 0) and (0, -7)
The point on the line 4x + 4y = -12 are (-3, 0) and (0, -3)
By plotting the points on the graph, we get
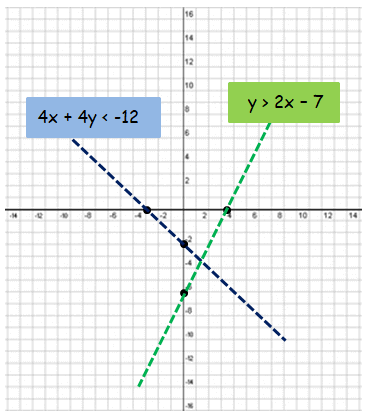
If x = -4 and y = -4, then -4 > 2(-4) - 7 (True)
So, we can shade the region which is left to y > 2x – 7
If x = -4 and y = -4, then 2 < 4(-4) + 4(-4) < -12 (True)
So, we can shade the region which is below to 4x + 4y < -12
Subscribe to our ▶️ YouTube channel 🔴 for the latest videos, updates, and tips.
Kindly mail your feedback to v4formath@gmail.com
We always appreciate your feedback.
About Us | Contact Us | Privacy Policy
©All rights reserved. onlinemath4all.com
Recent Articles
-
Specifying Units of Measure
Dec 15, 25 07:09 PM
Specifying Units of Measure -
Quantitative Reasoning Questions and Answers
Dec 14, 25 06:42 AM
Quantitative Reasoning Questions and Answers -
Coin Tossing Probability
Dec 13, 25 10:11 AM
Coin Tossing Probability - Concept - Sample Space - Formula - Solved Problems