WRITING INEQUALITIES FROM GRAPHS WORKSHEET
Subscribe to our ▶️ YouTube channel 🔴 for the latest videos, updates, and tips.
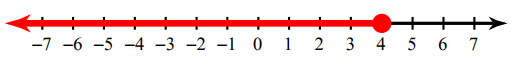
Problem 1 :
Write the inequality for the graph given below.
Problem 2 :
Write the inequality for the graph given below.

Problem 3 :
Write the inequality for the graph given below.
Problem 4 :
Write the inequality for the graph given below.
Problem 5 :
Write the inequality for the graph given below.
Write the inequality for the graph given below.
Problem 6 :

Problem 7 :

Problem 8 :

Problem 9 :

Problem 10 :


Detailed Answer Key
1. Answer :
In the above graph, we find the filled circle. So we have to use the sign ≤ or ≥.
Now we have to look into the shaded portion. Since the shaded region is in left hand side from the filled circle, we have to use the sign "≤ ".
The inequality for the above graph is x ≤ 4.
2. Answer :
In the above graph, we find the unfilled circle. So we have to use the sign < or >.
Now we have to look into the shaded portion. Since the shaded region is in right hand side from the unfilled circle, we have to use the sign "> ".
The inequality for the above graph is x > -6.
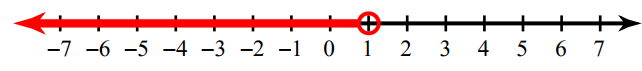
3. Answer :
In the above graph, we find the unfilled circle. So we have to use the sign < or >.
Now we have to look into the shaded portion. Since the shaded region is in left hand side from the unfilled circle, we have to use the sign "<".
The inequality for the above graph is x < 1.
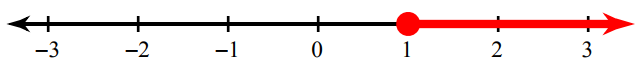
4. Answer :
In the above graph, we find the unfilled circle. So we have to use the sign ≤ or ≥.
Now we have to look into the shaded portion. Since the shaded region is in right hand side from the unfilled circle, we have to use the sign "≥".
The inequality for the above graph is x ≥ 1.
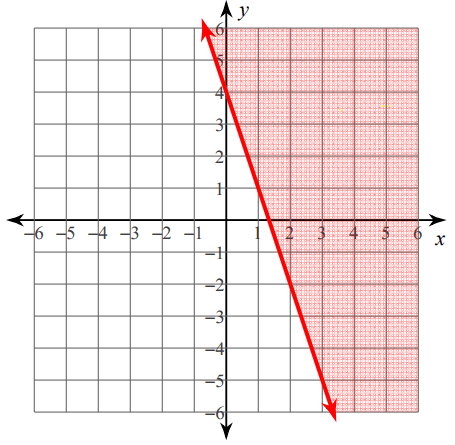
5. Answer :
From the above graph, first let us find the slope and y-intercept.
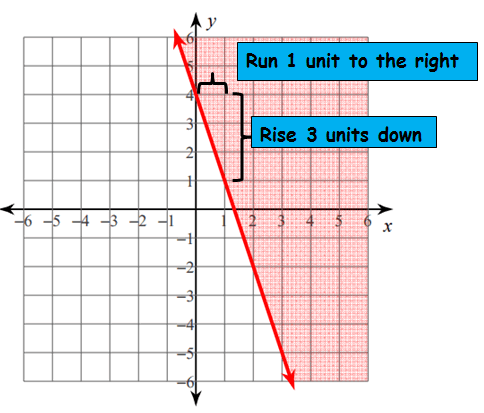
Rise = -3 and Run = 1
Slope = -3 / 1 = -3
y-intercept = 4
So, the equation of the given line is
y = -3x + 4
But we need to use inequality which satisfies the shaded region.
Since the graph contains solid line, we have to use one of the signs ≤ or ≥.
To fix the correct sign, let us take a point from the shaded region.
Take the point (2, 1) and apply it in the equation
y = -3x + 4
1 = -3(2) + 4
1 = -6 + 4
1 = - 2
Here 1 is greater than -2, so we have to choose the sign ≥ instead of equal sign in the equation y = -3x + 4.
Hence, the required inequality is
y ≥ -3x + 4
6. Answer :
By observing the shaded region, they are greater than 0. Since we have transparent circle at 0.
So, the required inequality is x > 0.
7. Answer :
By observing the shaded region, they are greater than 0-5 and lesser than 5.
(or)
The shaded region is in between -5 and 5. Near -5 and 5, we have transparent circle.
So, the required inequality is -5 < x < 5.
8. Answer :
Considering the shaded region, it is below the line. Since it is solid line, we may have to use ≤ or ≥.
y-intercept is 1. Choosing two points on the line, we get (1, 2) and (2, 3).
Slope = (y2 - y1) / (x2 - x1)
= (3 - 2) / (2 - 1)
= 1/1
= 1
Creating the equation :
y = mx + b
y = 1x + 1
Choosing one of the points from the shaded region is (2, 1).
1 = -1(2) + 1
1 = -2 + 1
1 = -1
To make the statement true, we have to use the inequality sign ≤.
So, the required inequality representing the shaded region in the given figure is y ≤ x + 1
9. Answer :
Considering the shaded region, it is above the line. Since it is dotted line, we may have to use < or >.
y-intercept is 0. Choosing two points on the line, we get (1, 2) and (2, 4).
Slope = (y2 - y1) / (x2 - x1)
= (4 - 2) / (2 - 1)
= 2/1
= 2
Creating the equation :
y = mx + b
y = 2x + 0
Choosing one of the points from the shaded region is (1, 3).
3 = 2(1) + 0
3 = 2
To make the statement true, we have to use the inequality sign >
So, the required inequality representing the shaded region in the given figure is y > 2x
10. Answer :
The given line is a solid line, we may have to use ≤ or ≥.
y-intercept is 5. Choosing two points on the line, we get (1, 4) and (2, 3).
Slope = (y2 - y1) / (x2 - x1)
= (3 - 4) / (2 - 1)
= -1/1
= -1
Creating the equation :
y = mx + b
y = -1x + 5
Choosing one of the points from the shaded region is (1, 3).
3 = -1(1) + 5
3 = -1 + 5
3 = 4
To make the statement true, we have to use the inequality sign ≥.
So, the required inequality representing the shaded region in the given figure is y ≥ -1x + 5
Subscribe to our ▶️ YouTube channel 🔴 for the latest videos, updates, and tips.
Kindly mail your feedback to v4formath@gmail.com
We always appreciate your feedback.
About Us | Contact Us | Privacy Policy
©All rights reserved. onlinemath4all.com

Recent Articles
-
Digital SAT Math Questions and Answers (Part - 13)
May 10, 26 05:50 PM
 Digital SAT Math Questions and Answers (Part - 13)
 -
Problems on Solving Logarithmic Equations
Apr 24, 26 09:30 PM
Problems on Solving Logarithmic Equations -
Solving Logarithmic Equations Worksheet
Apr 24, 26 09:05 PM
 Solving Logarithmic Equations Worksheet

