WRITE INEQUALITIES FROM GRAPHS
Subscribe to our ▶️ YouTube channel 🔴 for the latest videos, updates, and tips.
Inequalities in One Variable from Graphs
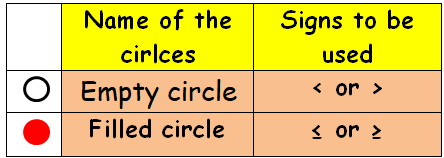
In the graph of an inequality in one variable, if there is empty circle, we have to use < and > in the inequality.
In the graph of an inequality in one variable, if there is filled circle, we have to use ≤ and ≥ in the inequality.
More clearly,
Example 1 :
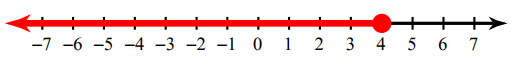
Write the inequality for the graph given below.
Solution :
In the above graph, we find the filled circle. So we have to use the sign ≤ or ≥.
Now we have to look into the shaded portion. Since the shaded region is in left hand side from the filled circle, we have to use the sign "≤ ".
The inequality for the above graph is x ≤ 4.
Example 2 :
Write the inequality for the graph given below.

Solution :
In the above graph, we find the unfilled circle. So we have to use the sign < or >.
Now we have to look into the shaded portion. Since the shaded region is in right hand side from the unfilled circle, we have to use the sign "> ".
The inequality for the above graph is x > -6.
Example 3 :
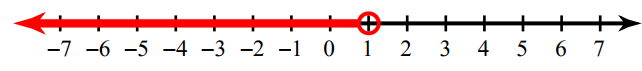
Write the inequality for the graph given below.
Solution :
In the above graph, we find the unfilled circle. So we have to use the sign < or >.
Now we have to look into the shaded portion. Since the shaded region is in left hand side from the unfilled circle, we have to use the sign "<".
The inequality for the above graph is x < 1.
Example 4 :
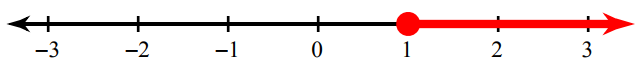
Write the inequality for the graph given below.
Solution :
In the above graph, we find the unfilled circle. So we have to use the sign ≤ or ≥.
Now we have to look into the shaded portion. Since the shaded region is in right hand side from the unfilled circle, we have to use the sign "≥".
The inequality for the above graph is x ≥ 1.
Inequalities in Two Variables from Graph
To find linear inequalities in two variables from graph, first we have to find two information from the graph.
(i) Slope
(ii) y -intercept
By using the above two information we can easily get a linear linear equation in the form y = mx + b.
Here "m" stands for slope and "b" stands for y-intercept.
Now we have to notice whether the given line is solid line or dotted line.
- If the graph contains the dotted line, then we have to use one of the signs < or >.
- If the graph contains the solid line, then we have to use one of the signs ≤ or ≥.
Example 5 :
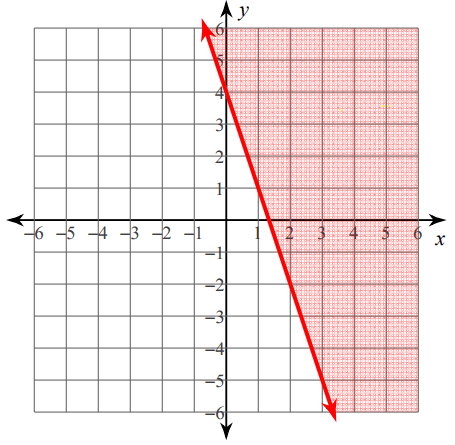
Write the inequality for the graph given below.
Solution :
From the above graph, first let us find the slope and y-intercept.
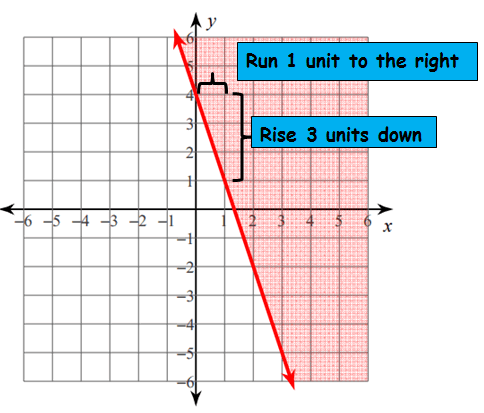
Rise = -3 and Run = 1
Slope = -3 / 1 = -3
y-intercept = 4
So, the equation of the given line is
y = -3x + 4
But we need to use inequality which satisfies the shaded region.
Since the graph contains solid line, we have to use one of the signs ≤ or ≥.
To fix the correct sign, let us take a point from the shaded region.
Take the point (2, 1) and apply it in the equation
y = -3x + 4
1 = -3(2) + 4
1 = -6 + 4
1 = - 2
Here 1 is greater than -2, so we have to choose the sign ≥ instead of equal sign in the equation y = -3x + 4.
Hence, the required inequality is
y ≥ -3x + 4
Example 6 :
Which graph shows the solutions of -2(1 - x) < 3(x - 2) ?

Solution :
-2(1 - x) < 3(x - 2)
Distributing -2 and 3 on both sides, we get
-2 + 2x < 3x - 6
Subtracting 3x on both sides
2x - 3x - 2 < -6
Adding 2 on both sides
-x - 2 < -6
-x < -6 + 2
-x < -4
Multiplying by -1 on both sides. While multiplying by negative, we have to flip the inequality sign.
x > 4
All values greater than 4 will be solution. So, option a is correct.
Example 7 :

Considering the shaded region, it is below the line. Since it is dotted line, we may have to use < or >.
We don't see the y-intercept in the given figure. Choosing two points on the line, we get (2, 1) and (3, 2).
Slope = (y2 - y1) / (x2 - x1)
= (2 - 1) / (3 - 2)
= 1/1
= 1
Creating the equation :
y = mx + b
y = 1x + b
Applying the point (3, 2) in the equation above,
2 = 1(3) + b
2 = 3 + b
b = 2 - 3
b = -1
Applying the y-intercept, we get
y = x - 1
Choosing one of the points from the shaded region is (3, 1).
1 = 1(3) - 1
1 = 3 - 1
1 = 2
To make the statement true, we have to use the inequality sign <.
So, the required inequality representing the shaded region in the given figure is y < x - 1.
Subscribe to our ▶️ YouTube channel 🔴 for the latest videos, updates, and tips.
Kindly mail your feedback to v4formath@gmail.com
We always appreciate your feedback.
About Us | Contact Us | Privacy Policy
©All rights reserved. onlinemath4all.com

Recent Articles
-
Digital SAT Math Questions and Answers (Part - 13)
May 10, 26 05:50 PM
 Digital SAT Math Questions and Answers (Part - 13)
 -
Problems on Solving Logarithmic Equations
Apr 24, 26 09:30 PM
Problems on Solving Logarithmic Equations -
Solving Logarithmic Equations Worksheet
Apr 24, 26 09:05 PM
 Solving Logarithmic Equations Worksheet