USING MULTIPLE SAMPLES TO COMPARE POPULATIONS
Subscribe to our ▶️ YouTube channel 🔴 for the latest videos, updates, and tips.
Many different random samples are possible for any given population, and their measures of center can vary. Using multiple samples can give us an idea of how reliable any inferences or predictions we make are.
Example 1 :
A group of about 250 students in grade 7 and about 250 students in grade 11 were asked, “How many hours per month do you volunteer?” Responses from one random sample of 10 students in grade 7 and one random sample of 10 students in grade 11 are summarized in the box plots.
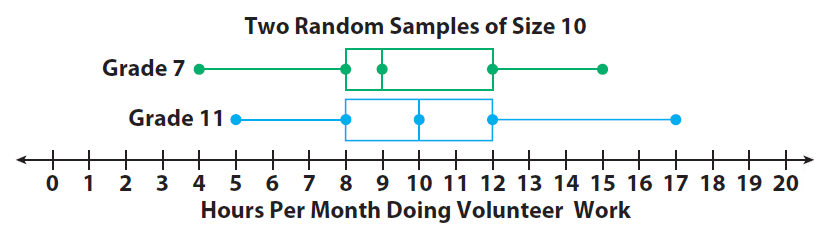
How can we tell if the grade 11 students do more volunteer work than the grade 7 students ?
Step 1 :
The median is higher for the students in grade 11. But there is a great deal of variation. To make an inference for the entire population, it is helpful to consider how the medians vary among multiple samples.
Step 2 :
The box plots below show how the medians from 10 different random samples for each group vary.
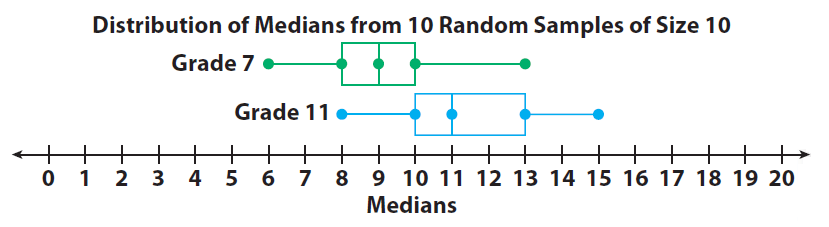
The medians vary less than the actual data. Half of the grade 7 medians are within 1 hour of 9. Half of the grade 11 medians are within 1 or 2 hours of 11.
Although the distributions overlap, the middle halves of the data barely overlap.
This is fairly convincing evidence that the grade 11 students volunteer more than the grade 7 students.
Example 2 :
The box plots show the variation in the means for 10 different random samples for the groups in the example. Why do these data give less convincing evidence that the grade 11 students volunteer more ?
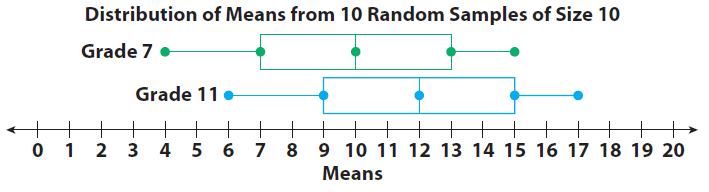
Answer :
Since, there is much more overlap between the two distributions, these data give less convincing evidence that the grade 11 students volunteer more
Subscribe to our ▶️ YouTube channel 🔴 for the latest videos, updates, and tips.
Kindly mail your feedback to v4formath@gmail.com
We always appreciate your feedback.
About Us | Contact Us | Privacy Policy
©All rights reserved. onlinemath4all.com
Recent Articles
-
10 Hard SAT Math Questions (Part - 38)
Dec 29, 25 04:21 AM
 10 Hard SAT Math Questions (Part - 38)
 -
10 Hard SAT Math Questions (Part - 39)
Dec 28, 25 11:20 PM
10 Hard SAT Math Questions (Part - 39) -
10 Hard SAT Math Questions (Part - 41)
Dec 28, 25 06:05 PM
 10 Hard SAT Math Questions (Part - 41)