USING BOXPLOTS TO MAKE INFERENCES
Subscribe to our ▶️ YouTube channel 🔴 for the latest videos, updates, and tips.
After obtaining a random sample of a population, we can make inferences about the population. Random samples are usually representative and support valid inferences.
We can use box plots to make inferences from a random sample.
Box and whisker-plot is the graph used in statistics to represent the central 50% of the values of a data set.
The picture figure given below clearly illustrates this.

In the above figure, the box spans interquartile range (central 50%).
To draw box and whisker-plot graph for a data set, we have to know lower quartile, upper quartile and median.
Steps to Construct Box and Whisker Plot
To construct box and whisker-plot for the given data set, we have to do the following steps.
Step 1 :
Write the observations of the given data set in ascending order.
Step 2 :
Find lower quartile, upper quartile and median using the formulas given below.
Lower quartile = (n + 1)/4
Upper quartile = 3(n + 1)/4
Median = (n + 1)/2
Here, n = number of observations in the given data set.
Step 3 :
Using lower quartile, upper quartile and median, we have to construct box and whisker-plot as given in the above picture.
Using Boxplots to Make Inferences
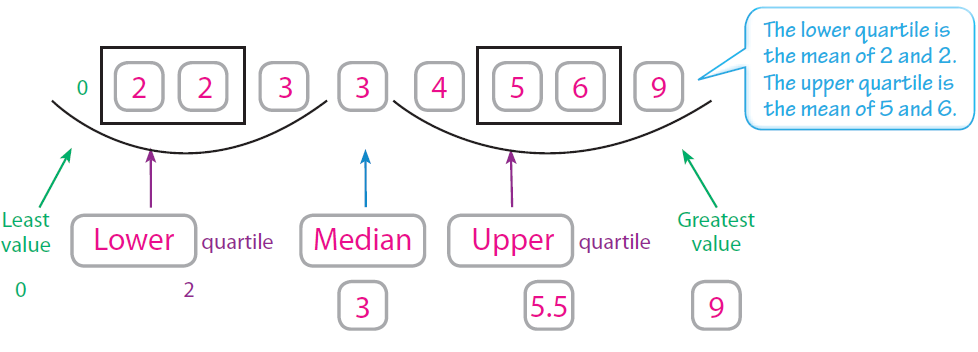
The number of pets owned by a random sample of students at Park Middle school is shown below.
9, 2, 0, 4, 6, 3, 3, 2, 5
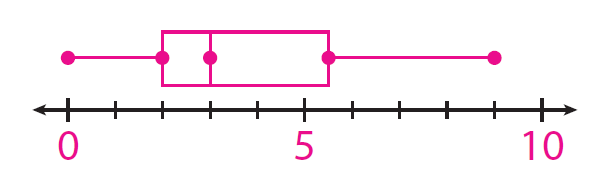
(i) Use the data to make a box plot.
Step 1 :
Order the data from least to greatest. Then find the least and greatest values, the median, and the lower and upper quartiles.
Step 2 :
The lower and upper quartiles can be calculated by finding the medians of each “half” of the number line that includes all the data.
Step 3 :
Draw a number line that includes all the data values.
Plot a point for each of the values found in Step 1.
Draw a box from the lower to upper quartile. Inside the box, draw a vertical line through the median. Finally, draw the whiskers by connecting the least and greatest values to the box.
(ii) What is a good measure for the most likely number of pets ?
A good measure for the most likely number of pets is 3.
(iii) How many pets does every student have ?
Almost every student in Parkview has at least 1 pet.
Subscribe to our ▶️ YouTube channel 🔴 for the latest videos, updates, and tips.
Kindly mail your feedback to v4formath@gmail.com
We always appreciate your feedback.
About Us | Contact Us | Privacy Policy
©All rights reserved. onlinemath4all.com

Recent Articles
-
AP Calculus AB Problems with Solutions (Part - 1)
May 29, 26 09:41 PM
 AP Calculus AB Problems with Solutions (Part - 1)
 -
SAT Math Practice Problems with Answers
May 21, 26 01:17 AM
 SAT Math Practice Problems with Answers
 -
Digital SAT Math Questions and Answers (Part - 13)
May 17, 26 09:03 AM
 Digital SAT Math Questions and Answers (Part - 13)