TABULAR PRESENTATION OF DATA
Subscribe to our ▶️ YouTube channel 🔴 for the latest videos, updates, and tips.
Tabulation may be defined as systematic presentation of data with the help of a statistical table having a number of rows and columns and complete with reference number, title, description of rows as well as columns and foot notes, if any.
We may consider the following guidelines for tabulation :
1. A statistical table should be allotted a serial number along with a self-explanatory title.
2. The table under consideration should be divided into caption, Box-head, Stub and Body.
Caption :
Caption is the upper part of the table, describing the columns and sub-columns, if any.
Box-Head :
The Box-head is the entire upper part of the table which includes columns and sub-column numbers, unit(s) of measurement along with caption.
Stub :
Stub is the left part of the table providing the description of the rows.
Body :
The body is the main part of the table that contains
the numerical figures.
3. The table should be well-balanced in length and breadth.
4. The data must be arranged in a table in such a way that comparison(s) between different figures are made possible without much labor and time.
Also the row totals, column totals, the units of measurement must be shown.
5. The data should be arranged intelligently in a well-balanced sequence and the presentation of data in the table should be appealing to the eyes as far as practicable.
6. Notes describing the source of the data and bringing clarity and, if necessary, about any rows or columns known as footnotes, should be shown at the bottom part of the table.
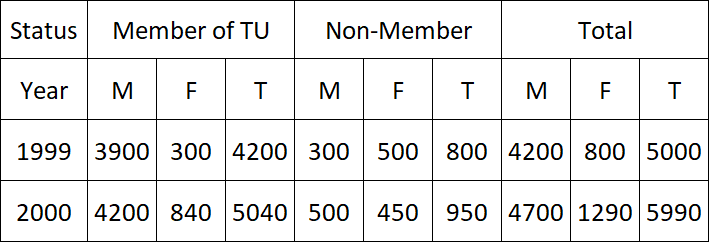
The textual presentation of data, relating to the workers of a factory is shown in the following table.
Status of the workers of the factory on the basis of their trade union membership for 1999 and 2000.
Source :
Here, we have to write the source through which we got the above data.
Footnote :
TU, M, F and T stand for trade union, male, female and total respectively.
The tabulation method is usually preferred to textual presentation as
(i) It facilitates comparison between rows and columns.
(ii) Complicated data can also be represented using tabulation.
(iii) It is a must for diagrammatic representation.
(iv) Without tabulation, statistical analysis of data is not possible.
Subscribe to our ▶️ YouTube channel 🔴 for the latest videos, updates, and tips.
Kindly mail your feedback to v4formath@gmail.com
We always appreciate your feedback.
About Us | Contact Us | Privacy Policy
©All rights reserved. onlinemath4all.com
Recent Articles
-
10 Hard SAT Math Questions (Part - 41)
Dec 24, 25 07:58 PM
 10 Hard SAT Math Questions (Part - 41)
 -
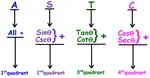
ASTC Formula in Trigonometry
Dec 23, 25 11:34 PM
 ASTC Formula in Trigonometry - Concepts - Examples and Solved Problems
 -
Coin Tossing Probability
Dec 23, 25 11:29 PM
Coin Tossing Probability - Concept - Sample Space - Formula - Solved Problems