SHIFTING THE GRAPH RIGHT OR LEFT EXAMPLES
Subscribe to our ▶️ YouTube channel 🔴 for the latest videos, updates, and tips.
Shifting a graph up or down :
Suppose f is a function and b > 0. Define functions g and h by
g(x) = f(x − b) and h(x) = f(x + b).
Then
- The graph of g is obtained by shifting the graph of f right b units;
- The graph of h is obtained by shifting the graph of f left b units.
- By subtracting b from the x-coordinate of f, we will get new x-coordinate of g(x).
- By adding b with the x-coordinate of f, we will get new x-coordinate of h(x).
The procedure for shifting the graph of a function to the right is illustrated by the following example:
Question 1 :
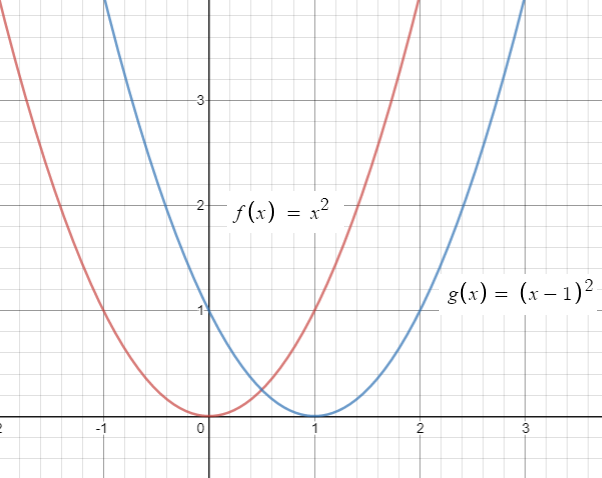
Define a function g by g(x) = f(x − 1), where f is the function defined by f(x) = x2, with the domain of f the interval [−1, 1].
(a) Find the domain of g.
(b) Find the range of g.
(c) Sketch the graph of g.
Solution :
(a) Here the function g(x) is defined precisely when f(x − 1) is defined. The domain of the function f(x) is [-1, 1]. By adding 1 with coordinates, we will get domain of g(x).
[-1+1, 1+1] ==> [0, 2]
(b) The range of f is [0, 1], we see that the values taken on by g are the same as the values taken on by f . Thus the range of g equals the range of f , which is the interval [0, 1].
(c) Sketch the graph of g(x) = (x - 1)2
Since 1 is subtracted from x, we have to move the graph 1 unit to the right side.
Question 2 :
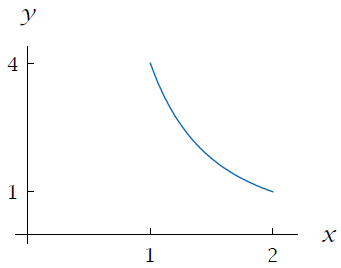
Assume that f is the function defined on the interval [1, 2] by the formula f(x) = 4 / x2 . Thus the domain of f is the interval [1, 2], the range of f is the interval [1, 4], and the graph of f is shown here.
The graph of g is obtained by shifting the graph of f left 3 units
For each function g described below:
(a) Sketch the graph of g.
(b) Find the domain of g (the endpoints of this interval should be shown on the horizontal axis of your sketch of the graph of g).
(c) Give a formula for g.
(d) Find the range of g (the endpoints of this interval should be shown on the vertical axis of your sketch of the graph of g).
Solution :
Shifting the graph of f left 3 units gives this graph.
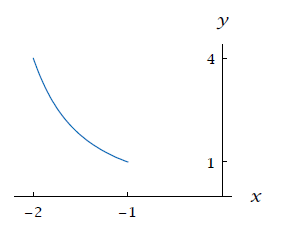
(b) The domain of g is obtained by subtracting 3 from every number in domain of f . Thus the domain of g is the interval [−2,−1].
(c) Because the graph of g is obtained by shifting the graph of f left 3 units, we have g(x) = f(x + 3). Thus g(x) = 4/(x + 3)2 for each number x in the interval [−2,−1].
(d) The range of g is the same as the range of f. Thus the range of g is the interval [1, 4].
Subscribe to our ▶️ YouTube channel 🔴 for the latest videos, updates, and tips.
Kindly mail your feedback to v4formath@gmail.com
We always appreciate your feedback.
About Us | Contact Us | Privacy Policy
©All rights reserved. onlinemath4all.com

Recent Articles
-
Digital SAT Math Questions and Answers (Part - 13)
May 10, 26 05:50 PM
 Digital SAT Math Questions and Answers (Part - 13)
 -
Problems on Solving Logarithmic Equations
Apr 24, 26 09:30 PM
Problems on Solving Logarithmic Equations -
Solving Logarithmic Equations Worksheet
Apr 24, 26 09:05 PM
 Solving Logarithmic Equations Worksheet