SAT MATH QUESTIONS ON PROBABILITY
Subscribe to our ▶️ YouTube channel 🔴 for the latest videos, updates, and tips.
Question 1 :
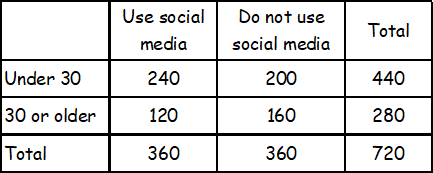
The table above shows the distribution of age and social media presence for 720 employees at a company. If an employee who uses social media is selected at random, what is the probability the employee is age 30 or older?
A) 1/3
B) 4/9
C) 1/2
D) 2/3
Answer :
Required Probability :
The correct answer choice is (A).
Question 2 :
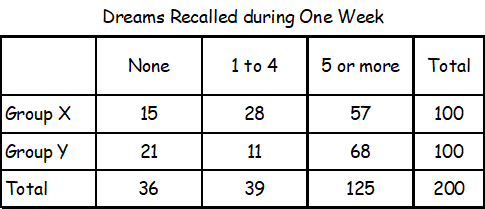
The data in the table above were produced by a sleep researcher studying the number of dreams people recall when asked to record their dreams for one week. Group X consisted of 100 people who observed early bedtimes, and Group Y consisted of 100 people who observed later bedtimes. If a person is chosen at random from those who recalled at least 1 dream, what is the probability that the person belonged to Group Y?
A) 68/100
B) 79/100
C) 79/164
D) 164/200
Answer :
Recalled at least 1 dream means minimum 1 dream to the maximum number of dreams.
Total number of persons who recalled at least 1 dream :
= 39 + 125
= 164
Number of persons who recalled at least 1 dream belonging to group Y :
= 11 + 68
= 79
Required Probability :
The correct answer choice is (C).
Question 3 :
Results on the Bar Exam of Law School Graduates :
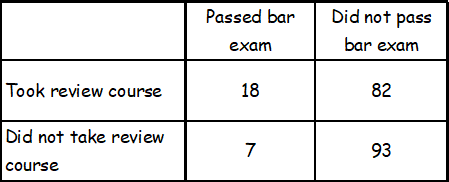
The table above summarizes the results of 200 law school graduates who took the bar exam. If one of the surveyed graduates who passed the bar exam is chosen at random for an interview, what is the probability that the person chosen did NOT take the review course?
A) 18/25
B) 7/25
C) 25/200
D) 7/200
Answer :
Required Probability :
The correct answer choice is (B).
Question 4 :
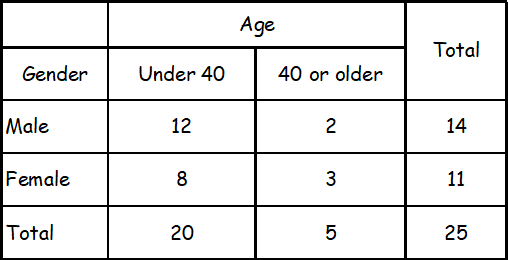
The table above shows the distribution of age and gender for 25 people who entered a contest. If the contest winner will be selected at random, what is the probability that the winner will be either a female under age 40 or a male age 40 or older?
A) 4/25
B) 10/25
C) 11/25
D) 16/25
Answer :
Of the 25 people who entered the contest, there are 8 females under age 40 and 2 males age 40 or older.
The probability that the contest winner will be either a female under age 40 or a male age 40 or older :
= P(female under age 40 or a male age 40 or older)
= (8 + 2)/25
= 10/25
The correct answer choice is (B).
Question 5 :
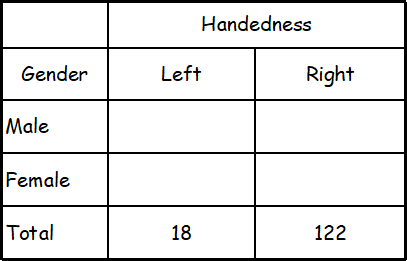
The incomplete table above summarizes the number of left-handed students and right-handed students by gender for the eighth-grade students at Keisel Middle School. There are 5 times as many right-handed female students as there are left-handed female students, and there are 9 times as many right-handed male students as there are left-handed male students. If there is a total of 18 left-handed students and 122 right-handed students in the school, which of the following is closest to the probability that a right-handed student selected at random is female? (Note: Assume that none of the eighth-grade students are both right-handed and left-handed.)
A) 0.410
B) 0.357
C) 0.333
D) 0.250
Answer :
Let x be the number of left-handed female students and let y be the number of left-handed male students.
Given : Number of right-handed female students is 5 times the number of left-handed female students, and number of right handed male students is 9 times the number of left-handed male students.
Number of right handed female students = 5x
Number of right handed male students = 9y
From the table above,
x + y = 18 ----(1)
5x + 9y = 122 ----(2)
-9(1) + (2) :
-4x = -40
Divide both sides by -4.
x = 10
Number of right handed female students :
= 5x
= 5(10)
= 50
Required probability :
The correct answer choice is (A).
Question 6 :
Number of Registered Voters in the United States in 2012, in Thousands
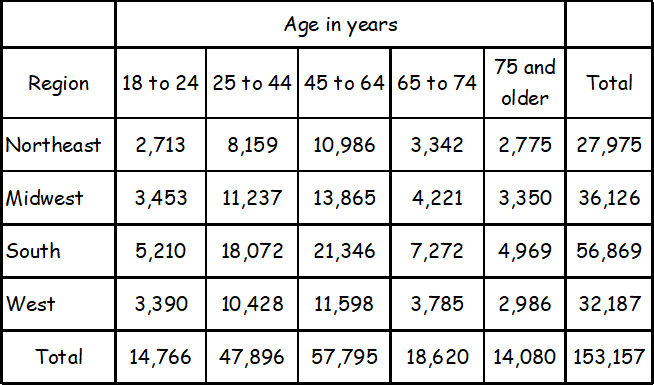
The table above shows the number of registered voters in 2012, in thousands, in four geographic regions and five age groups. Based on the table, if a registered voter who was 18 to 44 years old in 2012 is chosen at random, which of the following is closest to the probability that the registered voter was from the Midwest region?
A) 0.10
B) 0.25
C) 0.40
D) 0.75
Answer :
From the table above, in 2012, total registered voters between 18 and 44 years old :
= 14,766 + 47,896
= 62,662
Total registered voters between 18 and 44 years old from the Midwest region :
= 3,453 + 11,237
= 14,690
The probability that a randomly chosen registered voter who was between 18 and 44 years old in 2012 was from Midwest region :
= 14,690/62,666
≈ 0.234
Of the given choices, 0.25 is closest to 0.234.
The correct answer choice is (B).
Subscribe to our ▶️ YouTube channel 🔴 for the latest videos, updates, and tips.
Kindly mail your feedback to v4formath@gmail.com
We always appreciate your feedback.
About Us | Contact Us | Privacy Policy
©All rights reserved. onlinemath4all.com

Recent Articles
-
SAT Math Practice Problems with Answers
May 21, 26 01:17 AM
 SAT Math Practice Problems with Answers
 -
Digital SAT Math Questions and Answers (Part - 13)
May 17, 26 09:03 AM
 Digital SAT Math Questions and Answers (Part - 13)
 -
Problems on Solving Logarithmic Equations
Apr 24, 26 09:30 PM
Problems on Solving Logarithmic Equations

