REPRESENTING RATES WITH TABLES AND GRAPHS WORKSHEET
Subscribe to our ▶️ YouTube channel 🔴 for the latest videos, updates, and tips.
Problem 1 :
Look at the picture given below.
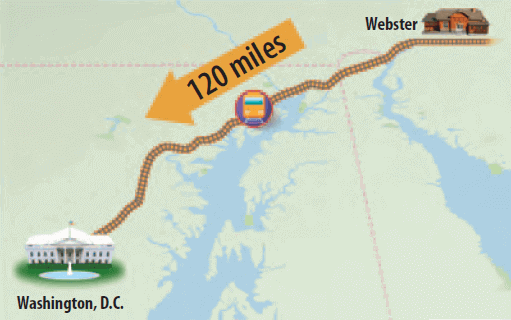
An express train travels from Webster to Washington, D.C., at a constant speed and makes the trip in 2 hours.
Fromm the above information, answer the following questions :
(i) Make a table to show the distance the train travels in various amounts of time.
(ii) Graph the information from the table.
(iii) Use the graph to find how long the train takes to travel 90 miles.
Problem 2 :
Look at the picture below.

Lily drives from Clarkson to Humbolt in 2 hours. Suppose Lily drives for 10 hours. If she maintains the same driving rate, can she drive more than 600 miles ?

Answers
1. Solution :
(i) Answer :
Write a ratio of distance to time to find the rate.

Use the unit rate to make a table.
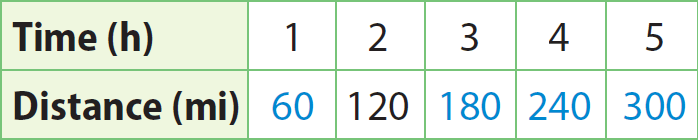
(ii) Answer :
Write ordered pairs with time as the x-coordinate and distance as the y-coordinate.
(1, 60), (2, 120), (3, 180), (4, 240), (5, 300)
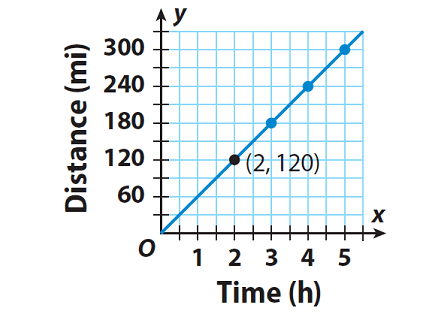
Graph the ordered pairs. Fractions and decimals can represent times and distances, so connect the points.
(iii) Answer :
When we look at the graph carefully, the value on y - axis which is corresponding to 1.5 on x-axis is 90.
Look at the graph given below.
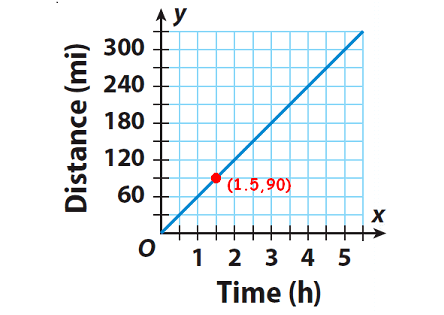
When we look at the above graph carefully, the value on y- axis which is corresponding to the value 1.5 on x-axis is 90.
The point (1.5, 90) is on the graph, so the train takes 1.5 hours.
2. Solution :
A double number line graph is useful, because the regular intervals represent equivalent rates that compare different quantities. The one shown compares the number of miles driven to the time driven for different amounts of time.
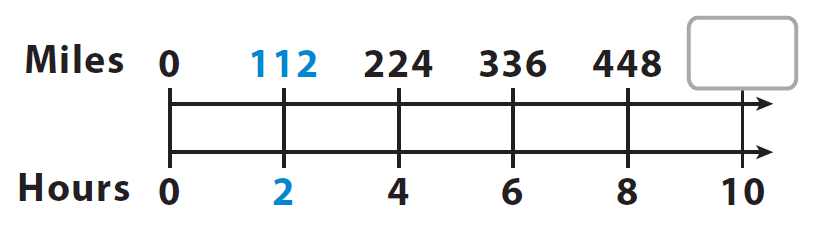
She covers 112 miles of distance in 2 hours. Since she maintains the same driving rate, every 2 hours, the distance covered will be increased by 112 miles.
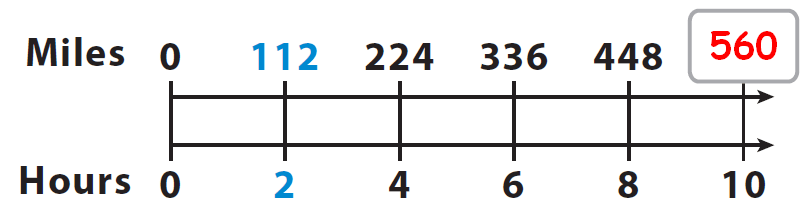
In 8 hours she would have covered 448 miles of distance. After 2 hours, that is in 10 hours, the distance covered will be increased by 112 miles.
So, the distance covered in 10 hours is 560 miles.
It is shown in the double number line graph given below.
Conclusion :
From the above working, it is clear that she can not cover more than 600 miles in 10 hours, if she maintains the same driving rate.
Subscribe to our ▶️ YouTube channel 🔴 for the latest videos, updates, and tips.
Kindly mail your feedback to v4formath@gmail.com
We always appreciate your feedback.
About Us | Contact Us | Privacy Policy
©All rights reserved. onlinemath4all.com

Recent Articles
-
AP Calculus AB Problems with Solutions (Part - 1)
May 29, 26 09:41 PM
 AP Calculus AB Problems with Solutions (Part - 1)
 -
SAT Math Practice Problems with Answers
May 21, 26 01:17 AM
 SAT Math Practice Problems with Answers
 -
Digital SAT Math Questions and Answers (Part - 13)
May 17, 26 09:03 AM
 Digital SAT Math Questions and Answers (Part - 13)