RANDOM SAMPLING AND NON RANDOM SAMPLING
Subscribe to our ▶️ YouTube channel 🔴 for the latest videos, updates, and tips.
When information is being gathered about a group, the entire group of objects, individuals, or events is called the population.
Because gathering information about each member of a large group can be difficult or impossible, researchers often study a part of the population, called a sample.
The size of a sample and the way the sample is chosen can have an effect on whether the sample is representative of the population or not.
Example :
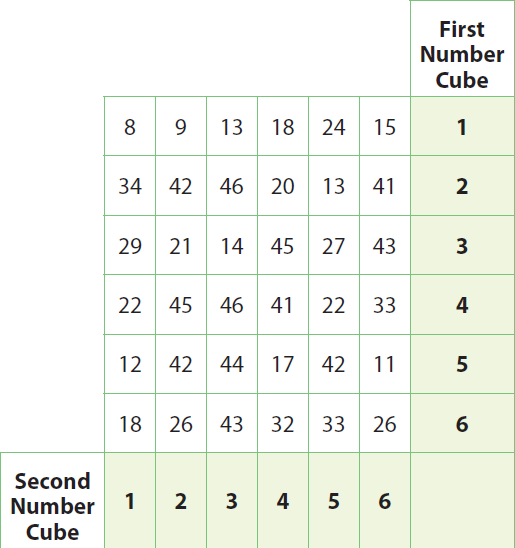
A vegetable garden has 36 tomato plants arranged in a 6-by-6 array. The gardener wants to know the average number of tomatoes on the plants.
Each white cell in the table shown below represents a plant. The number in the cell tells how many tomatoes are on that particular plant.

Because counting the number of tomatoes on all of the plants is too time-consuming, the gardener decides to choose plants at random to find the average number of tomatoes on them.
To simulate the random selection, roll two number cubes 10 times. Find the cell in the table identified by the first and second number cubes. Record the number in each randomly selected cell.
A. What is the average number of tomatoes on the 10 plants that were randomly selected ?
Answers will vary based on each student’s results.
B. Alternately, the gardener decides to choose the plants in the first row. What is the average number of tomatoes on these plants ?
The average number of tomatoes on these plants is 14.5 tomatoes.
C. How do the averages you got with each sampling method compare to the average for the entire population, which is 28.25 ?
The random sample is closer to the actual average. The first row average is much lower.
D. Why might the first method give a closer average than the second method ?
The plants in the first row seem to have fewer tomatoes than the plants in other rows, so it is not representative of the whole plot.
Subscribe to our ▶️ YouTube channel 🔴 for the latest videos, updates, and tips.
Kindly mail your feedback to v4formath@gmail.com
We always appreciate your feedback.
About Us | Contact Us | Privacy Policy
©All rights reserved. onlinemath4all.com

Recent Articles
-
US Common Core K-12 Curricum Algebra Solving Simple Equations
Jan 07, 26 01:53 PM
US Common Core K-12 Curricum Algebra Solving Simple Equations -
10 Hard SAT Math Questions (Part - 4)
Jan 05, 26 06:56 PM
10 Hard SAT Math Questions (Part - 4) -
10 Hard SAT Math Questions (Part - 3)
Jan 05, 26 06:34 PM
10 Hard SAT Math Questions (Part - 3)

