MEASURES OF CENTRAL TENDENCY
Subscribe to our ▶️ YouTube channel 🔴 for the latest videos, updates, and tips.
Central tendency may be defined as the tendency of a given set of observations to cluster around a single central or middle value and the single value that represents the given set of observations is described as a measure of central tendency or, location, or average.
Hence, it is possible to condense a vast mass of data by a single representative value.
The computation of a measure of central tendency plays a very important part in many a sphere.
A company is recognized by its high average profit, an educational institution is judged on the basis of average marks obtained by its students and so on.
Furthermore, the central tendency also facilitates us in providing a basis for comparison between different distribution. Following are the different measures of central tendency:
(i) Arithmetic Mean (AM)
(ii) Median (Me)
(iii) Mode (Mo)
(iv) Geometric Mean (GM)
(v) Harmonic Mean (HM)
Criteria for an Ideal Measure of Central Tendency
Following are the criteria for an ideal measure of central tendency:
(i) It should be properly and unambiguously defined.
(ii) It should be easy to comprehend.
(iii) It should be simple to compute.
(iv) It should be based on all the observations.
(v) It should have certain desirable mathematical properties.
(vi) It should be least affected by the presence of extreme observations.
Arithmetic Mean
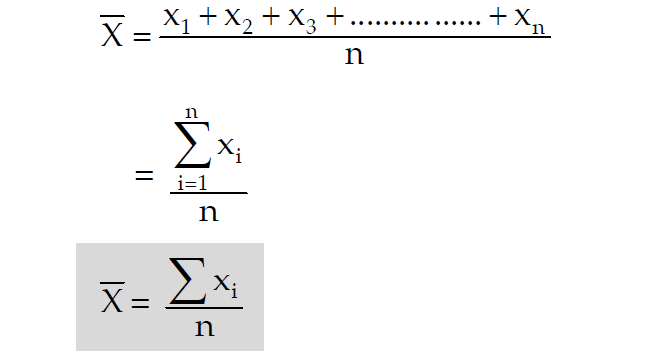
Arithmetic mean (AM) is one of the measures of central tendency which can be defined as the sum of all observations divided by the number of observations.
Let the variable "x" assume "n" values as given below

Then, the AM of 'x' to be denoted by x̄ and it is given by
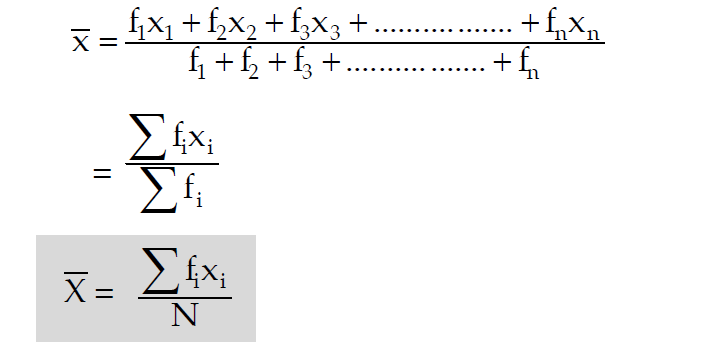
In case of a simple frequency distribution relating to an attribute, we have
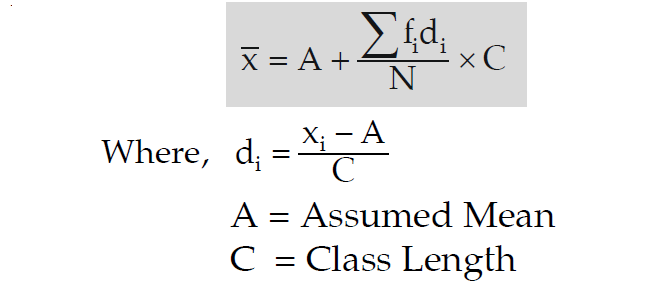
In the above frequency distribution, if the original value "x" is changed to "d", due to the shift of origin (assumed mean) by A units and scale (class length ) by C units, then the formula for AM is given by
If there are two groups containing n₁ and n₂ observations
x̄₁ and x̄₂ are the respective arithmetic means, then the combined arithmetic-mean is given by
x̄ = (n1x̄1 + n2x̄2) / (n1 + n2)
This property could be extended to more than two groups and we may write it as
x̄ = ∑nx̄ / ∑n
Here,
∑nx̄ = n1x̄1 + n2x̄2 + ..............
∑n = n1 + n2 + ........................
Median
Median is one of the measures of central tendency which can be defined as follows.
Median is the middle-most value when the observations are arranged either in an ascending order or a descending order of magnitude.
For example, if the marks of the 7 students are 72, 85,56,80,65,52 and 68, then in order to find the median mark, we arrange these observations in the following ascending order of magnitude:
52, 56, 65, 68, 72, 80, 85.
Since the 4th term i.e. 68 in this new arrangement is the middle most value, the median mark is68
i.e. Median (Me) = 68
As a second example, if the wages of 8 workers, expressed in dollars are 56, 82, 96, 120, 110, 82, 106, 100 then arranging the wages as before, in an ascending order of magnitude, we get Rs.56, Rs.82, Rs.82, Rs.96, Rs.100, Rs.106, Rs.110, Rs.120.
Since there are two middle-most values, namely, Rs.96, and Rs.100 any value between Rs.96 and Rs.100 may be, theoretically, regarded as median wage.
However, to bring uniqueness, we take the arithmetic mean of the two middle-most values, whenever the number of the observations is an even number.
Thus, the median wage in this example, would be
M = (96 + 100) / 2 = 98
In case of a grouped frequency distribution, we find median from the cumulative frequency distribution of the variable under consideration.
We may consider the following formula, which can be derived from the basic definition of median.
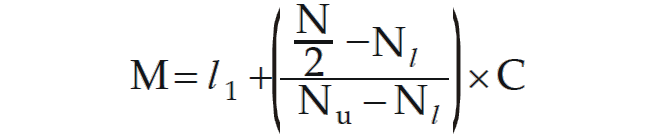
Where,
l1 = lower class boundary of the median class i.e. the class containing median.
N = total frequency.
Nl = less than cumulative frequency corresponding to l₁. (Pre median class)
Nu = less than cumulative frequency corresponding to l₂. (Post median class)
l2 being the upper class boundary of the median class.
C = l2 – l1 = length of the median class.
Mode
Mode is one of the measures of central tendency which can be defined as follows.
For a given set of observations, mode may be defined as the value that occurs the maximum number of times.
Thus, mode is that value which has the maximum concentration of the observations around it. This can also be described as the most common value with which, even, a layman may be familiar with.
Thus, if the observations are 5, 3, 8, 9, 5 and 6, then Mode (Mo) = 5 as it occurs twice and all the other observations occur just once.
The definition for mode also leaves scope for more than one mode. Thus sometimes we may come across a distribution having more than one mode. Such a distribution is known as a multi-modal distribution. Bi-modal distribution is one having two modes.
Furthermore, it also appears from the definition that mode is not always defined. As an example,
If the marks of 5 students are 50, 60, 35, 40, 56, there is no modal mark as all the observations occur once i.e. the same number of times.
We may consider the following formula for computing mode from a grouped frequency distribution:
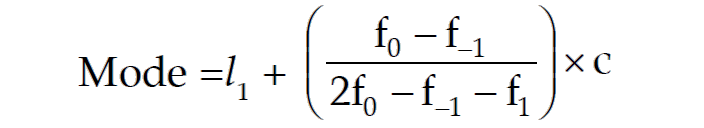
Where,
l1 = LCB of the modal class
f0 = frequency of the modal class
f-1 = frequency of the pre modal class
f1 = frequency of the post modal class
C = class length of the modal class
Geometric Mean
Geometric mean is one of the measures of central tendency which can be defined as follows.
For a given set of n positive observations, the geometric mean is defined as the n-th root of the product of the observations.
Let the variable "x" assume "n" values as given below
All the above values are being positive, then the GM of x is given by

For a grouped frequency distribution, the GM is given by

Where, N = ∑f
Harmonic Mean
Harmonic mean is one of the measures of central tendency which can be defined as follows.
For a given set of non-zero observations, harmonic-mean is defined as the reciprocal of the AM of the reciprocals of the observation.
Let the variable "x" assume "n" values as given below
All the above values are being non zero values, then the HM of x is given by

For a grouped frequency distribution, we have

If there are two groups with n₁ and n₂ observations and H₁ and H₂ as respective HM’s than the combined HM is given by

Measures of Central Tendency Review
After discussing the different measures of central tendency, now we are in a position to have a review of these measures of central tendency so far as the relative merits and demerits are concerned on the basis of the requisites of an ideal measure of central tendency which we have already mentioned.
The best measure of central tendency, usually, is the AM.
It is rigidly defined, based on all the observations, easy to comprehend, simple to calculate and amenable to mathematical properties.
However, AM has one drawback in the sense that it is very much affected by sampling fluctuations. In case of frequency distribution, mean cannot be advocated for open-end classification.
Like AM, median is also rigidly defined and easy to comprehend and compute. But median is not based on all the observation and does not allow itself to mathematical treatment.
However, median is not much affected by sampling fluctuation and it is the most appropriate measure of central tendency for an open-end classification.
Although mode is the most popular measure of central tendency, there are cases when mode remains undefined. Unlike mean, it has no mathematical property. Mode is also affected by sampling fluctuations.
GM and HM, like AM, possess some mathematical properties. They are rigidly defined and based on all the observations.
But they are difficult to comprehend and compute and, as such, have limited applications for the computation of average rates and ratios and such like things.
Subscribe to our ▶️ YouTube channel 🔴 for the latest videos, updates, and tips.
Kindly mail your feedback to v4formath@gmail.com
We always appreciate your feedback.
About Us | Contact Us | Privacy Policy
©All rights reserved. onlinemath4all.com

Recent Articles
-
SAT Math Practice Problems with Answers
May 21, 26 01:17 AM
 SAT Math Practice Problems with Answers
 -
Digital SAT Math Questions and Answers (Part - 13)
May 17, 26 09:03 AM
 Digital SAT Math Questions and Answers (Part - 13)
 -
Problems on Solving Logarithmic Equations
Apr 24, 26 09:30 PM
Problems on Solving Logarithmic Equations

