LINEAR GROWTH AND DECAY
Subscribe to our ▶️ YouTube channel 🔴 for the latest videos, updates, and tips.
Linear Growth
Consider the relationship represented by the table shown below.
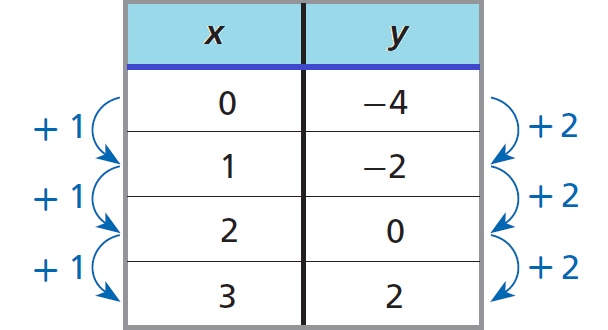
In the table above, a constant change of +1 in x corresponds to a constant change +2 in y.
Therefore, the relationship given in the table above represents linear growth, because each y-value is 2 more than the value before it.
Linear Decay
Consider the relationship represented by the table shown below.
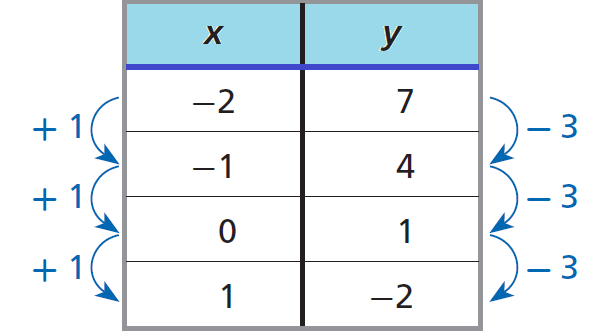
In the table above, a constant change of +1 in x corresponds to a constant change -3 in y.
Therefore, the relationship given in the table above represents linear decay, because each y-value is 3 less than the value before it.
Linear Growth :
Linear growth can be modeled by a straight line with a positive slope.
For example, if James has a piggybank with 75 dollars already in it, and he adds 10 dollars every month, the total amount in the piggybank can be modeled by
A = 10t + 75
where A is the total amount, t is the number of months, and 50 (the y-intercept) is the initial amount.
The diagram shown below illustrates the above example.
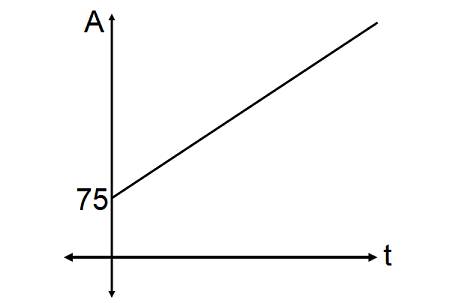
Unlike exponential growth, linear growth doesn't have moments when it slows down or speeds up. Here, growth is constant and it goes up by the same amount each time.
Linear Decay :
Linear decay can be modeled by a straight line with a negative slope.
For example, imagine James now takes 10 dollars every month out of her piggybank, which initially contained 100 dollars. Then, the final amount in the piggybank can be modeled by
A = 100 - 10t
where A is the total amount, t is the number of months, and 100 (the y-intercept) is the initial amount.
The diagram shown below illustrates the above example.
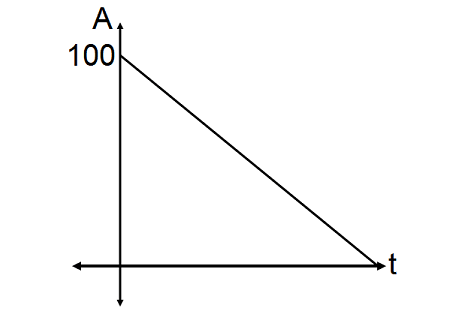
Here, the decrease is at a constant rate and the slope is negative.
Positive Association and Negative Association
Positive Association :
Both exponential growth and linear growth are examples of a positive association between two things.
A positive association happens, when two variables move in the same direction.
That is, an increase on the part of one variable introduces an increase on the part of the other variable or a decrease on the part of one variable introduces a decrease on the part of the other variable.
For example, the number of hours spent on studying and final exam scores :
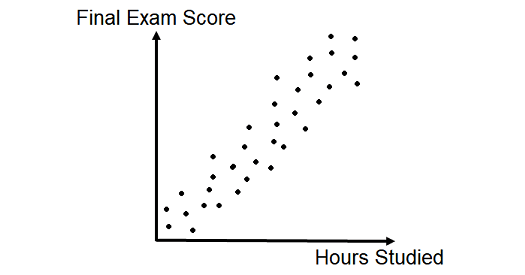
When the data points are close to forming a smooth line or graph that shows the negative relationship, we can say there is a strong negative association.
The graph above shows a positive association that is quite strong.
Negative Association :
Both exponential decay and linear decay are examples of a negative association between two things.
A negative association happens, when two variables move in the opposite directions.
That is, an increase on the part of one variable results a decrease on the part of the other variable or a decrease on the part of one variable results an increase on the part of the other variable.
For example, the number of absences over the semester and final exam scores :
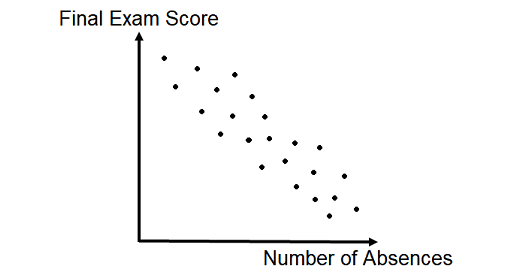
The graph above shows a negative association that is quite strong.
Subscribe to our ▶️ YouTube channel 🔴 for the latest videos, updates, and tips.
Kindly mail your feedback to v4formath@gmail.com
We always appreciate your feedback.
About Us | Contact Us | Privacy Policy
©All rights reserved. onlinemath4all.com

Recent Articles
-
Digital SAT Math Questions and Answers (Part - 13)
May 17, 26 09:03 AM
 Digital SAT Math Questions and Answers (Part - 13)
 -
Problems on Solving Logarithmic Equations
Apr 24, 26 09:30 PM
Problems on Solving Logarithmic Equations -
Solving Logarithmic Equations Worksheet
Apr 24, 26 09:05 PM
 Solving Logarithmic Equations Worksheet