LINEAR GRAPHS
Subscribe to our ▶️ YouTube channel 🔴 for the latest videos, updates, and tips.
Linear graphs are nothing but the graphs of straight lines. Linear relationship is being used in our day to day life. This relationship can be expressed in many different ways.
Linear graph is one way of expressing this relationship, when graphed they give a straight line. Linear graph can be sketched or plotted.
Example 1 :
An equation such as x - 2y = -2 is an example of a linear equation in the two variables x and y.
A solution of this equation is an ordered pair of numbers (x0, y0) so that x0 and y0 satisfy the equation x - 2y = -2, in the sense that x0 - 2y0 = -2.
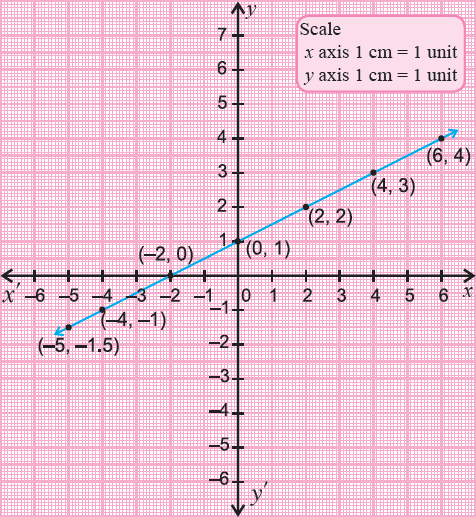
Using the above method of getting all the solutions of the equation x - 2y = -2, we can plot as many points of the graph as we please to get a good idea of the graph.
For example, the adjacent picture contains the following points (given by the dots) on the graph, going from left to right :
(-5, -1.5), (-4, -1), (-2, 0), (0, 1), (2, 2), (4, 3), (6, 4).
These points strongly suggest that the graph of x - 2y = -2 is a straight line.
General Equation of Linear Graphs
Thus, a first degree equation in two variables always represents a straight line. Hence we can take general equation of a straight line as ax + by + c = 0, with at least one of a or b not equal to zero.
For the sake of simplicity to draw lines in graphs we consider y = mx + b. as another simple form of the equation of straight line. For each value of x, the equation y = mx + b gives a value of y and we can obtain an ordered pair (x, y).
Important Note
(i) If c = 0, then the equation becomes ax + b = 0 and the line passes through the origin.
(ii) If a = 0, then the equation becomes by + c = 0 and the line is parallel to x-axis.
(iii) If b = 0, then the equation becomes ax + c = 0 and the line is parallel to y-axis.
Procedure to Draw a Linear Graph
When graphing an equation, we usually begin by creating a table of x and y values. We do this by choosing three x values and computing the corresponding y values.
Although two points are sufficient to sketch the graph of a line, we usually choose three points so that we can check our work.
Step 1 :
Using the given equation construct a table of with x and y values.
Step 2 :
Draw x-axis and y-axis on the graph paper.
Step 3 :
Select a suitable scale on the coordinate axes.
Step 4 :
Plot the points
Step 5 :
Join the points and extend it to get the line.
Drawing Linear Graph
Example 2 :
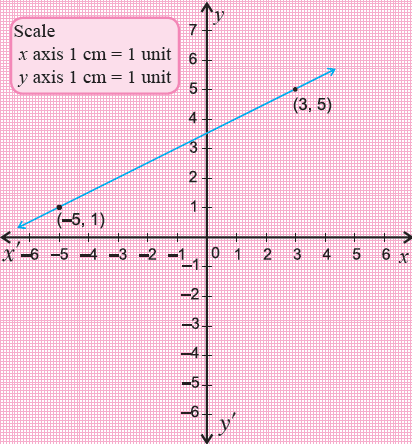
Draw the graph of the line joining the points
(3, 5) and (-5, 1)
Solution :
Step 1 :
Draw the x-axis and y-axis on a graph sheet with 1 cm = 1 unit on both axes.
Step 2 :
We plot the two given points (3, 5), (-5, 1) on the graph sheet.
Step 3 :
We join the points by a line segment and extend it on either direction.
Step 4 :
We get the required linear graph.
Example 3 :
To get from the second floor to the first floor in a mall, you can either ride the escalator or take the stairs. The graph shows the vertical distance y (in feet) you have left to travel on the escalator after x seconds.

a. Write an equation in slope-intercept form of the linear function representing the amount of time you have left on the escalator.
b. How long does it take to ride the escalator from the second floor to the first floor?
c. The equation y = −1.6x + 20 represents the vertical distance y (in feet) you have left to travel on the stairs after x seconds. How much time do you save by taking the stairs?
Solution :
a) Two points on the line are (0, 20) and (20, 0).
Slope = (y2 - y1) / (x2 - x1)
= (0 - 20) / (20 - 0)
= -20/20
= -1
So, the required slope is -1.
b) By creating the equation of linear function in the graph shown above,
y-intercept = 20
Slope intercept form :
y = mx + b
y = -x + 20
After 20 seconds in the excalator, the person can reach the first floor from the second floor.
c) y = -1.6x + 20
by finding the x-intercept, we get
-1.6x + 20 = 0
-1.6x = -20
x = 20/1.6
x = 12.5
In 12.5 seconds the person reaches the first floor.
A person can save = 20 - 12.5
= 7.5 seconds
Example 4 :
You have $100 in your savings account and plan to deposit $12.50 each month.
a. Graph a linear equation that represents the balance in your account.
b. How many months will it take you to save enough money to buy 10 acres of land on Mars?

Solution :
Initial deposit amount i have = $100
Let x be the number of months required.
Let y be the total amount of savings after x months.
y = 100 + 12.50x
|
x-intercept : Put y = 0 12.50x + 100 = 0 12.50x = -100 x = -100/12.50 = -8 |
y-intercept : Put x = 0 12.50(0) + 100 = y y = 100 |

b) Number of months needed to save $175
100 + 12.50x = 175
12.50 x = 175 - 100
12.50x = 75
x = 75/12.50
x = 6
So, the required numnber of months to purchase land in mars is 6.
Subscribe to our ▶️ YouTube channel 🔴 for the latest videos, updates, and tips.
Kindly mail your feedback to v4formath@gmail.com
We always appreciate your feedback.
About Us | Contact Us | Privacy Policy
©All rights reserved. onlinemath4all.com

Recent Articles
-
AP Calculus AB Problems with Solutions (Part - 1)
May 29, 26 09:41 PM
 AP Calculus AB Problems with Solutions (Part - 1)
 -
SAT Math Practice Problems with Answers
May 21, 26 01:17 AM
 SAT Math Practice Problems with Answers
 -
Digital SAT Math Questions and Answers (Part - 13)
May 17, 26 09:03 AM
 Digital SAT Math Questions and Answers (Part - 13)