KEY FEATURES OF FUNCTIONS
Subscribe to our ▶️ YouTube channel 🔴 for the latest videos, updates, and tips.
Following are the key features of functions.
1. Domain and Range
2. x-intercept and y-intercept
3. Positive and Negative intervals
4. Intervals of increasing, decreasing and constant behavior
5. Parent Functions
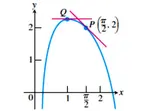
6. Maxima and Minima
Domain and Range
Domain :
The domain is the set of all possible inputs or x-values. To find the domain of a function, we have to look at the x-axis of the graph.
Determining Domain :
1. Start at the origin.
2. Move along the x-axis until you find the lowest possible x-value. This is your lower bound.
3. Return to the origin.
4. Move along the x-axis until you find your highest possible x-value. This is your upper bound.
Range :
The range is the set of all possible outputs or y-values. To find the range of the graph, we have to look at the y-axis of the graph.
Determining Range :
For the range, do the same thing but move along the y-axis.
x-intercepts and y-intercepts
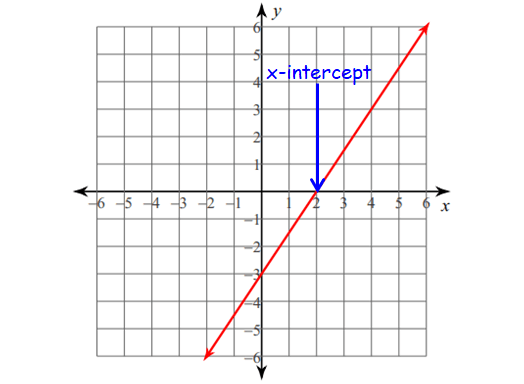
x-intercept :
1. This is where the graph crosses the x-axis.
2. To find it algebraically, set y = 0.
3. Have many names :
- x-intercept
- Roots
- Zeros
Example :
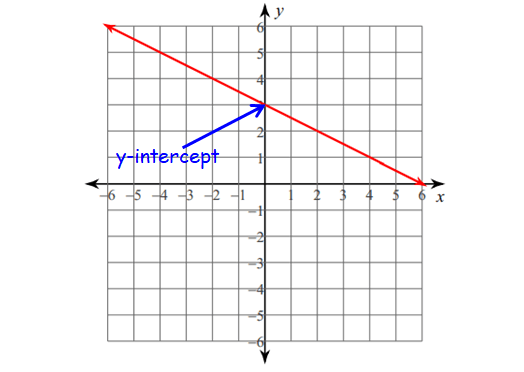
y-intercept :
1. This is where the graph crosses the y-axis.
2. To find it algebraically, set x = 0.
Example :
Positive and Negative Intervals
Positive Interval :
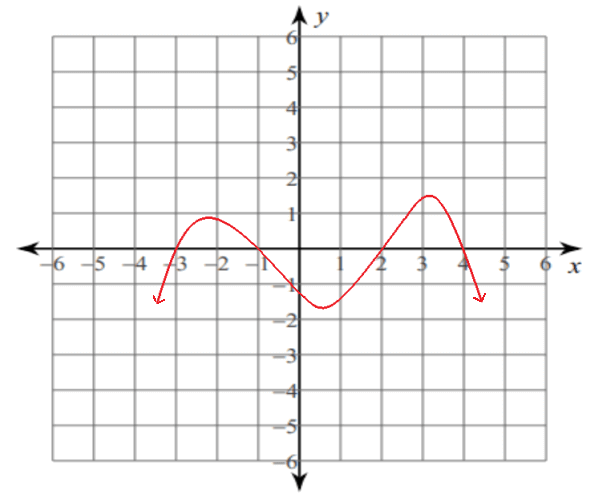
In the diagram above, the graph of the function is above the x-axis in the following intervals.
(-3, -1) and (2, 4)
More precisely, y is positive when x ∈ (-3, -1) and (2, 4).
So, the positive intervals for the above graph are
(-3, -1) and (2, 4)
Negative Interval :
In the diagram above, the graph of the function is below the x-axis in the following intervals.
(-∞, -3), (-1, 2) and (4, +∞)
More precisely, y is negative when x ∈ (-∞, -3), (-1, 2) and (4, +∞).
So, the negative intervals for the above graph are
(-∞, -3), (-1, 2) and (4, +∞)
Types of Function Behavior
There are three types of function behavior :
1. Increasing
2. Decreasing
3. Constant
When determining the type of behavior, we always have to move from left to right on the graph.
1. Increasing :
- When x increases, y will also increase
- Direct variation
2. Decreasing :
- When x increases, y will decrease
- Inverse variation
3. Constant :
- When x increases, y will stay the same
Identifying Intervals of Behavior
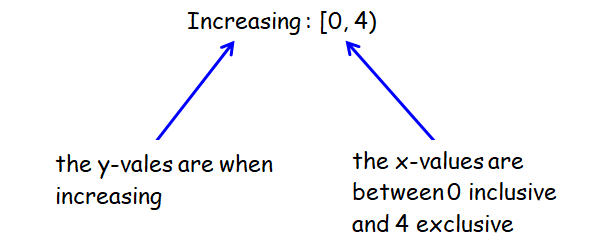
We use interval notation to represent the behavior of the function.
The interval measures x-values. The type of behavior describes y-values.
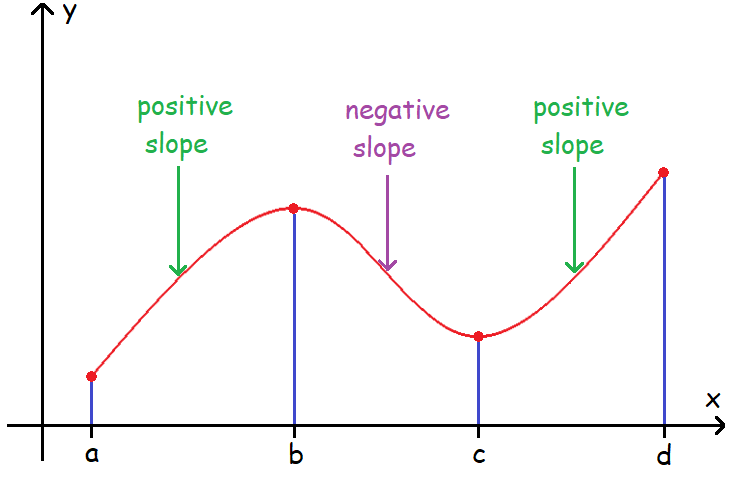
In the diagram above,
* the graph is increasing in the intervals :
(a, b) and (c, d)
* the graph is decreasing in the interval :
(b, c)
Parent Functions and Their Graphs
The most basic for a type of function.
Determines the general shape of the graph (the end behavior).
Baby Functions
Look and behave similarly to their parent functions.
To get a 'baby' function, add, subtract, multiply, and/or divide parent function by constants.
Example :
Function Name :
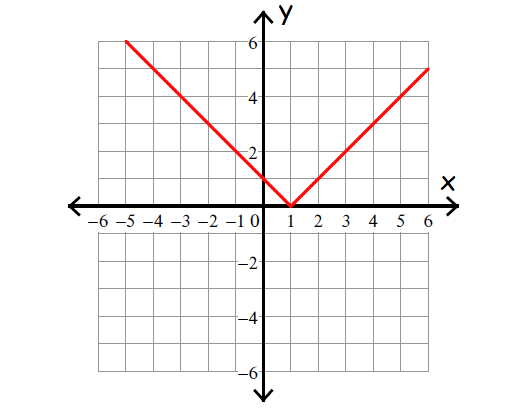
Absolute Value
Parent Function :
f(x) = |x|
Baby Function :
f(x) = |x - 1|
Identifying Parent Functions
From equations, identify the most important operation :
- Special Operations (Absolute Value)
- Division by x
- Highest Exponent (this includes square roots and cube roots)
Examples :
1. f(x) = x2 + 5x + 6
2. f(x) = 3 / (x + 2)
3. f(x) = 3|x| + 5
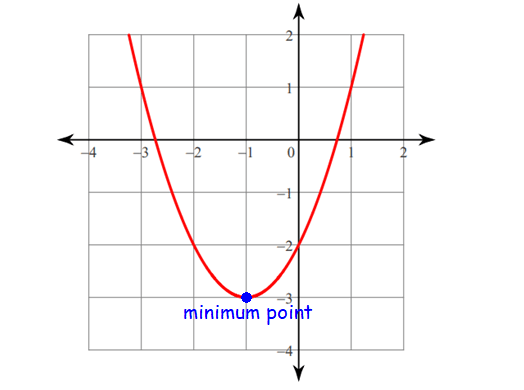
Maximum (Maxima) and Minimum (Minima) Points
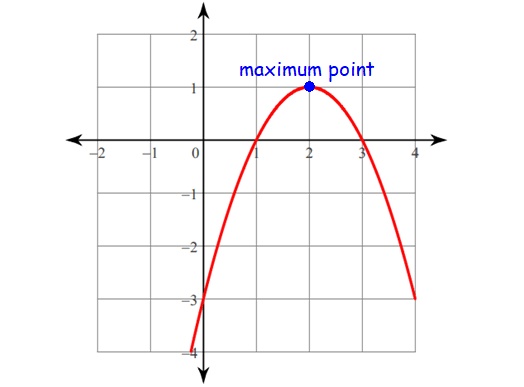
Maximum Point (Maxima) :
Peaks (or hills) are the maximum points.
Minimum Point (Minima) :
Valleys are the minimum points.
Subscribe to our ▶️ YouTube channel 🔴 for the latest videos, updates, and tips.
Kindly mail your feedback to v4formath@gmail.com
We always appreciate your feedback.
About Us | Contact Us | Privacy Policy
©All rights reserved. onlinemath4all.com

Recent Articles
-
AP Calculus AB Problems with Solutions (Part - 1)
May 29, 26 09:41 PM
 AP Calculus AB Problems with Solutions (Part - 1)
 -
SAT Math Practice Problems with Answers
May 21, 26 01:17 AM
 SAT Math Practice Problems with Answers
 -
Digital SAT Math Questions and Answers (Part - 13)
May 17, 26 09:03 AM
 Digital SAT Math Questions and Answers (Part - 13)