INTERPRETING LINE GRAPHS
Subscribe to our ▶️ YouTube channel 🔴 for the latest videos, updates, and tips.
By observing the upward or downward slant of the lines connecting the points, you can describe the trends in the data and predict future events.
Example 1 :
The temperature of water in a kettle is graphed over a 10 minute period.
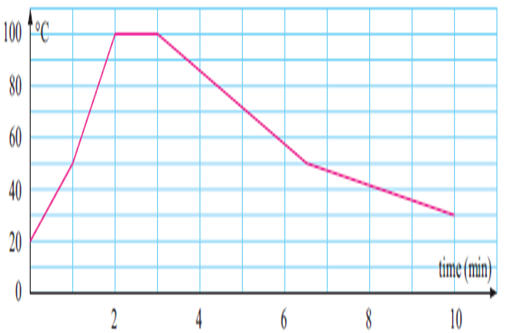
a) What was the room temperature when the kettle was switched on ?
b) How long did it take for the water to boil ?
c) For how long did the water boil ?
d) At what times was the water temperature 50oC ?
e) During what period was the temperature decreasing ?
Solution :
(a) At that time when kettle was switched on, the time will be 0.
By observing the graph the value on the vertical axis at 0 is 20.
(b) Boiling temperature of water is 100o C, to reach boiling temperature is 2 minutes.
(c) The water is boiling 1 minute.
(d) At 7.5 minutes the temperature of water will be at 50o C .
(e) After 3 minutes the temperature is being decreased.
Example 2 :
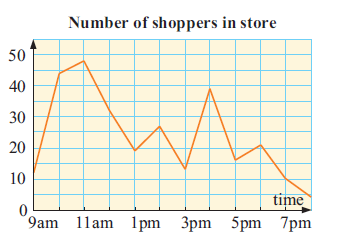
Managers of a retail store conduct a customer count to help them decide how to roster their sales staff. The results are shown in the line graph.
a) At what time was the number of people in the store greatest ?
b) At what time was the number of people in the store least?
c) Describe what happened in the store between 3 pm and 4 pm.
d) Use the graph to estimate the number of people in the store at 9:30 am.
Solution :
(a) At 11 am the number of people in the store greatest.
(b) At 8 pm the number of people will be less.
(c) Between 3 pm to 4 pm, the number of customers being increased.
(d) At the time 9.30 am, approximately 45 people will be there.
Example 3 :
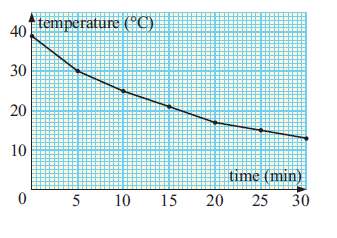
When a bottle of soft drink was placed in a refrigerator, its temperature was measured at 5-minute intervals. The results are graphed alongside.
a) Determine the temperature of the liquid when it was first placed in the refrigerator.
b) Find the time taken for the temperature to drop to 20o C.
c) Find the temperature after 10 minutes in the refrigerator.
d) Find the fall in temperature during
(i) the first 15 minutes (ii) the next 15 minutes.
Solution :
(a) The temperature of liquid when it was first placed in the refrigerator is 40o C.
(b) To drop the temperature 20o C, it will take 15 minutes.
(c) The temperature after 10 minutes is 25o C.
(d) In first 15 minutes, the temperature dropped 18o C, and in the next 15 minutes the temperature has dropped 7o C
Subscribe to our ▶️ YouTube channel 🔴 for the latest videos, updates, and tips.
Kindly mail your feedback to v4formath@gmail.com
We always appreciate your feedback.
About Us | Contact Us | Privacy Policy
©All rights reserved. onlinemath4all.com

Recent Articles
-
Digital SAT Math Questions and Answers (Part - 13)
May 10, 26 05:50 PM
 Digital SAT Math Questions and Answers (Part - 13)
 -
Problems on Solving Logarithmic Equations
Apr 24, 26 09:30 PM
Problems on Solving Logarithmic Equations -
Solving Logarithmic Equations Worksheet
Apr 24, 26 09:05 PM
 Solving Logarithmic Equations Worksheet