IDENTIFY LINEAR AND NONLINEAR FUNCTIONS WORKSHEET
Subscribe to our ▶️ YouTube channel 🔴 for the latest videos, updates, and tips.
Questions 1-4 : Determine whether each table represents a linear or nonlinear function.
Question 1 :
|
x 1 3 5 7 |
y -2 1 4 7 |
Question 2 :
|
x -1 1 3 5 |
y -2 6 22 46 |
Question 3 :
|
x 0 3 6 9 |
y 0 3 9 18 |
Question 4 :
|
x 0 4 8 12 |
y 4 2 0 -2 |
Questions 5-8 :Determine whether each graph represents a linear or nonlinear function.
Question 5 :
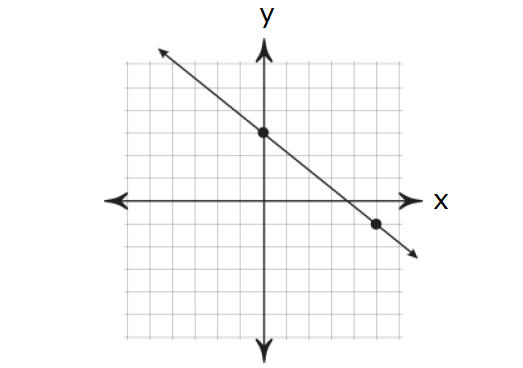
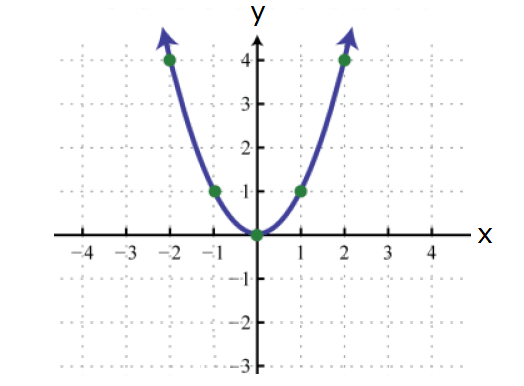
Question 6 :
Question 7 :
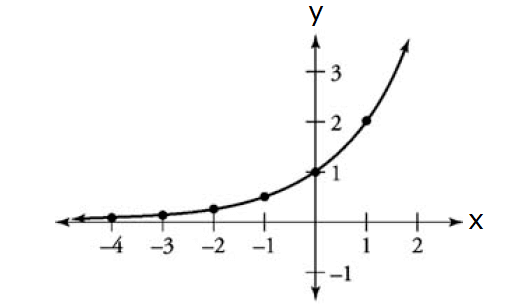
Question 8 :
Questions 9-13 : Determine whether each equation represents a linear or nonlinear function. Remember that all linear functions can be written in the slope-intercept form, that is y = mx + b.
Question 9 :
y = 5x + 2
Question 10 :
y = 3(x - 4)
Question 11 :
y = x/2 + 5
Question 12 :
y = 2/x - 3
Question 13 :
y = -5x
Question 14 :
Account A earns simple interest. Account B earns compound interest. The table shows the balances for 5 years. Graph the data and compare the graphs.

Question 15 :
The table shows the volume V (in cubic feet) of a cube with a side length of x feet. Does the table represent a linear or nonlinear function? Explain.
|
Side Length, x 1 2 3 4 5 6 7 8 |
Volume (V) 1 8 27 64 125 216 343 512 |
Question 16 :
The table shows the cost y (in dollars) of x pounds of sunflower seeds.
a. What is the missing y-value that makes the table represent a linear function?
b. Write a linear function that represents the cost y of x pounds of seeds.


1. Answer :
|
x 1 3 5 7 |
y -2 1 4 7 |
In the above table, as x increases by 2, y increases by 3. The rate of change is constant. So, the above table represents a linear function.
2. Answer :
|
x -1 1 3 5 |
y -2 6 22 46 |
In the above table, as x increases by 2, y increases by a greater amount each time. The rate of change is NOT constant. So, the above table represents a nonlinear function.
3. Answer :
|
x 0 3 6 9 |
y 0 3 9 18 |
In the above table, as x increases by 3, y increases by a greater amount each time. The rate of change is NOT constant. So, the above table represents a nonlinear function.
4. Answer :
|
x 0 4 8 12 |
y 4 2 0 -2 |
In the above table, as x increases by 4, y decreases by 2 each time. The rate of change is constant. So, the above table represents a linear function.
5. Answer :
The above graph is a straight line. So it represents a linear function.
6. Answer :
The above graph is not a straight line. So it represents a nonlinear function.
7. Answer :
The above graph is a straight line. So it represents a linear function.
8. Answer :
The above graph is not a straight line. So it represents a nonlinear function.
9. Answer :
y = 5x + 2
The above function is in slope-intercept form.
So, it represents a linear function.
10. Answer :
y = 3(x - 4)
The above function can be written in slope-intercept form.
y = 3(x - 4)
y = 3x - 12
So, it represents a linear function.
11. Answer :
y = x/2 + 5
The above function can be written in slope-intercept form.
y = x/2 + 5
y = (1/2)x + 5
y = 0.5x + 5
So, it represents a linear function.
12. Answer :
y = 2/x - 3
The above function cannot be written in slope-intercept form.
So, it represents a nonlinear function.
13. Answer :
y = -5x
y = -5x + 0
The above function is in slope-intercept form.
So, it represents a linear function.
14. Answer :
The balance of Account A has a constant rate of change of $10. So, the function representing the balance of Account A is linear.
The balance of Account B increases by different amounts each year. Because the rate of change is not constant, the function representing the balance of Account B is nonlinear.

15. Answer :
|
Side Length, x 1 2 3 4 5 6 7 8 |
Volume (V) 1 8 27 64 125 216 343 512 |
Changes in x is the same, it differs by 1. Changes in y is not the same. Then it is not a constant function.
16. Answer :
Solution :
a) Since it is linear function, the rate of change
= 2.80/2
= 1.40
When x = 3, y = 2.80 + 1.40
= 4.2
b) y = 1.4x
Subscribe to our ▶️ YouTube channel 🔴 for the latest videos, updates, and tips.
Kindly mail your feedback to v4formath@gmail.com
We always appreciate your feedback.
About Us | Contact Us | Privacy Policy
©All rights reserved. onlinemath4all.com

Recent Articles
-
SAT Math Practice Problems with Answers
May 21, 26 01:17 AM
 SAT Math Practice Problems with Answers
 -
Digital SAT Math Questions and Answers (Part - 13)
May 17, 26 09:03 AM
 Digital SAT Math Questions and Answers (Part - 13)
 -
Problems on Solving Logarithmic Equations
Apr 24, 26 09:30 PM
Problems on Solving Logarithmic Equations

