HOW TO IDENTIFY FUNCTION FROM GRAPH
Subscribe to our ▶️ YouTube channel 🔴 for the latest videos, updates, and tips.
By using the concept vertical line test, we can easily check whether the graph represents the function or not.
This is a tool which can be used to test whether the given graph represents a function or not.
The following are the steps of vertical line test :
Step 1 :
Draw a vertical line at any where on the given graph.
Step 2 :
We have to check whether the vertical line drawn on the graph intersects the graph in at most one point.
Step 3 :
If the vertical line intersects the graph in at most one point, then the given graph represents a function.
If the vertical line intersects the graph in more than one point, then the given graph does not represent a function.
Caution :
For some graphs, the vertical line will intersect the graph in one point at one position and more than one point at a different position.
In the above situation, the graph will not represent a function.
Key Concept :
A graph represents a function only if every vertical line intersects the graph in at most one point.
We can have better understanding on vertical line test for functions through the following examples.
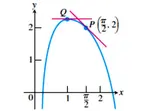
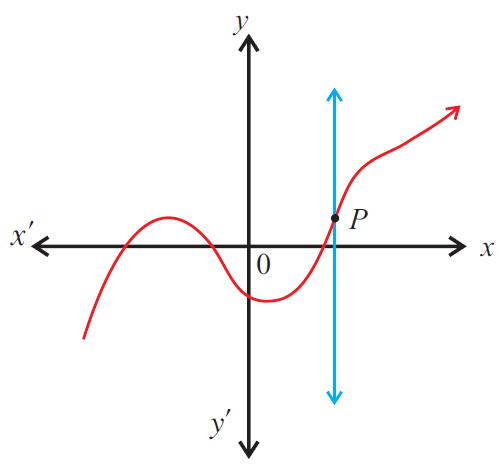
Example 1 :
Use the vertical line test to determine whether the following graph represents a function.
Solution :
Step 1 :
Draw a vertical line at any where on the given graph.
Step 2 :
We have to check whether the vertical line drawn on the graph intersects the graph in at most one point.
Step 3 :
In the above graph, the vertical line intersects the graph in at most one point, then the given graph represents a function.
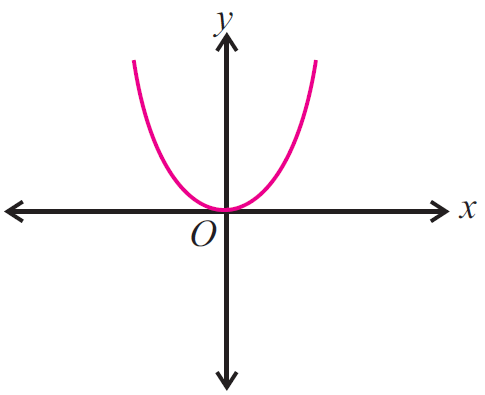
Example 2 :
Use the vertical line test to determine whether the following graph represents a function.
Solution :
Step 1 :
Draw a vertical line at any where on the given graph.
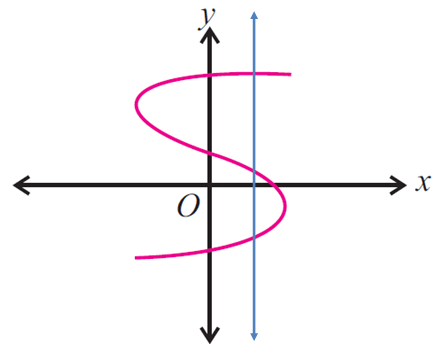
Step 2 :
We have to check whether the vertical line drawn on the graph intersects the graph in at most one point.
Step 3 :
In the above graph, the vertical line intersects the graph in more than one point (three points), then the given graph does not represent a function.
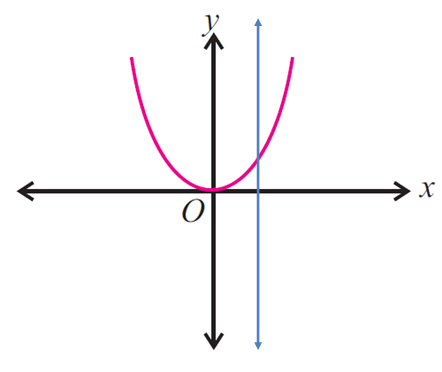
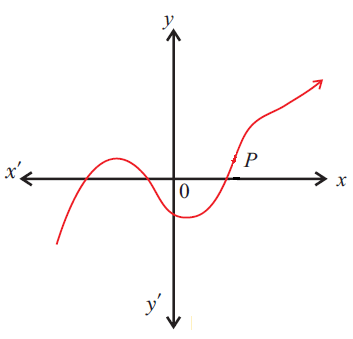
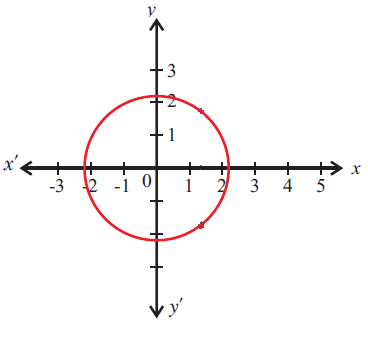
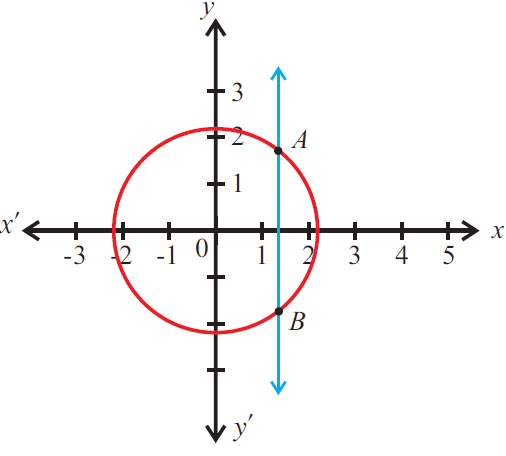
Example 3 :
Use the vertical line test to determine whether the following graph represents a function.
Solution :
Step 1 :
Draw a vertical line at any where on the given graph.
Step 2 :
We have to check whether the vertical line drawn on the graph intersects the graph in at most one point.
Step 3 :
In the above graph, the vertical line intersects the graph in more than one point (three points), then the given graph does not represent a function.
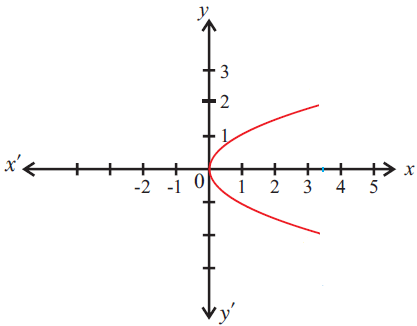
Example 4 :
Use the vertical line test to determine whether the following graph represents a function.
Solution :
Step 1 :
Draw a vertical line at any where on the given graph.
Step 2 :
We have to check whether the vertical line drawn on the graph intersects the graph in at most one point.
Step 3 :
In the above graph, the vertical line intersects the graph in at most one point, then the given graph represents a function.
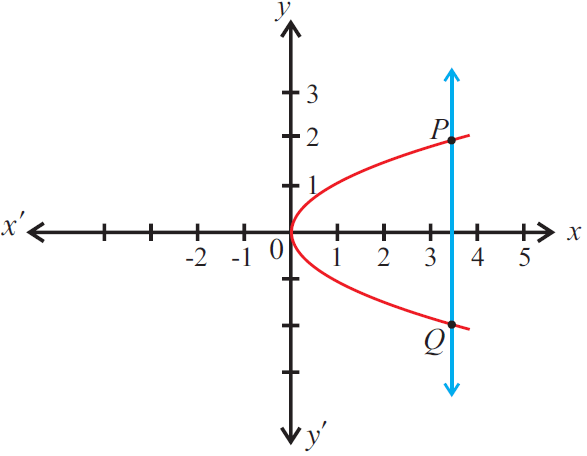
Example 5 :
Use the vertical line test to determine whether the following graph represents a function.
Solution :
Step 1 :
Draw a vertical line at any where on the given graph.
Step 2 :
We have to check whether the vertical line drawn on the graph intersects the graph in at most one point.
Step 3 :
In the above graph, the vertical line intersects the graph in more than one point (three points), then the given graph does not represent a function.
Example 6 :
Is the relationship a function? Justify your answer. Use the words “input” and “output” in your explanation, and connect them to the context represented by the graph.

Rachel plans to study 2 hours for her next exam. How might plotting her grade on the same graph change your answer to above question ?
Solution :
Yes, the above relationship is a function. When we draw a vertical line, it is intersecting the graph maximum once.
When the number of hours is 2, then the grade will be 95.
Example 7 :
The graph shows the relationship between the number of hours students spent studying for an exam and the exam grades. Is the relationship represented by the graph a function?

Solution :
The input values are the number of hours spent studying by each student. The output values are the exam grades. The points represent the following ordered pairs:
(1, 70) (2, 70) (2, 85) (3, 75) (5, 80) (6, 82) (7, 88) (9, 90) (9, 95) (12, 98)
Notice that 2 is paired with both 70 and 85, and 9 is paired with both 90 and 95. Therefore, since these input values are paired with more than one output value, the relationship is not a function.
Subscribe to our ▶️ YouTube channel 🔴 for the latest videos, updates, and tips.
Kindly mail your feedback to v4formath@gmail.com
We always appreciate your feedback.
About Us | Contact Us | Privacy Policy
©All rights reserved. onlinemath4all.com

Recent Articles
-
AP Calculus AB Problems with Solutions (Part - 1)
May 29, 26 09:41 PM
 AP Calculus AB Problems with Solutions (Part - 1)
 -
SAT Math Practice Problems with Answers
May 21, 26 01:17 AM
 SAT Math Practice Problems with Answers
 -
Digital SAT Math Questions and Answers (Part - 13)
May 17, 26 09:03 AM
 Digital SAT Math Questions and Answers (Part - 13)