HOW TO DRAW FREQUENCY POLYGON WITHOUT HISTOGRAM
Subscribe to our ▶️ YouTube channel 🔴 for the latest videos, updates, and tips.
The following steps will be useful to draw frequency polygon without histogram.
Step 1 :
Obtain the frequency distribution and compute the mid points of each class interval.
Step 2 :
Represent the mid points along the X-axis and the frequencies along the Y-axis.
Step 3 :
Plot the points corresponding to the frequency at each mid point.
Step 4 :
Join these points, by straight lines in order.
Step 5 :
To complete the polygon join the point at each end immediately to the lower or higher class marks (as the case may be at zero frequency) on the X-axis.
Example 1 :
Draw a frequency polygon for the following data without using histogram.
|
Class interval 10 - 20 20 - 30 30 - 40 40 - 50 50 - 60 60 - 70 70 - 80 80 - 90 |
Frequency 4 6 8 10 12 14 7 5 |
Solution :
|
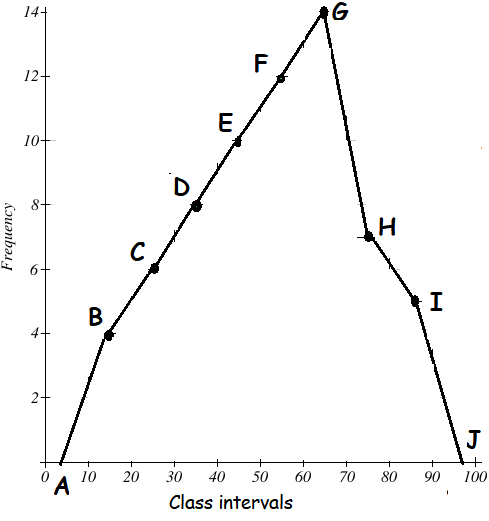
Class interval 0 - 10 10 - 20 20 - 30 30 - 40 40 - 50 50 - 60 60 - 70 70 - 80 80 - 90 90 - 100 |
Mid points 5 15 25 35 45 55 65 75 85 95 |
Frequency 0 4 6 8 10 12 14 7 5 0 |
Mark the class intervals along the X-axis and the frequency along the Y-axis. We take the imagined classes 0-10 at the beginning and 90-100 at the end, each with frequency zero. We have tabulated the data as shown.
Using the adjacent table, plot the points A (5, 0), B (15, 4), C (25, 6), D (35, 8), E (45, 10), F (55, 12), G (65, 14), H (75, 7), I (85, 5) and J (95, 0).
We draw the line segments AB, BC, CD, DE, EF, FG, GH, HI, IJ to obtain the required frequency polygon ABCDEFGHIJ, which is shown in the picture given below.
Scale :
X - axis 1 cm = 10 units
Y - axis 1 cm = 2 units
Example 2 :
Draw a frequency polygon for the following data without using histogram
|
Age (in years) 0 - 10 10 - 20 20 - 30 30 - 40 40 - 50 50 - 60 60 - 70 |
Number of persons 6 11 25 35 18 12 6 |
Solution :
|
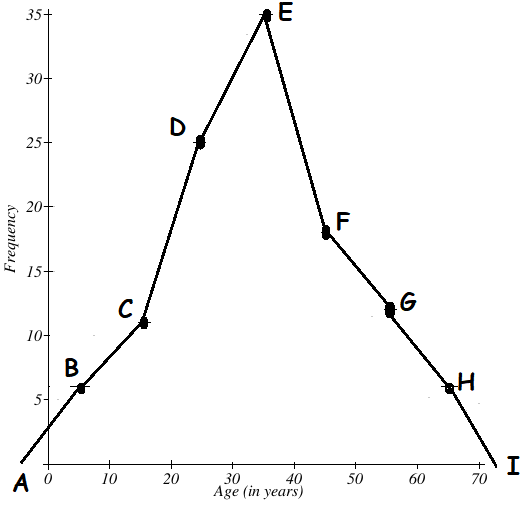
Class interval 0 - 10 10 - 20 20 - 30 30 - 40 40 - 50 50 - 60 60 - 70 70 - 80 |
Mid points 5 15 25 35 45 55 65 75 |
Frequency 6 11 25 35 18 12 6 0 |
Mark the class intervals along the X-axis and the frequency along the Y-axis. We take the imagined classes 0-10 at the beginning and 60-70 at the end, each with frequency zero. We have tabulated the data as shown.
Using the adjacent table, plot the points A (5, 6), B (15, 11), C (25, 25), D (35, 35), E (45, 18), F (55, 12), G (65, 6), and H (75, 0)
We draw the line segments AB, BC, CD, DE, EF, FG, GH, HI to obtain the required frequency polygon ABCDEFGHI, which is shown in the picture given below.
Scale :
X - axis 1 cm = 10 units
Y - axis 1 cm = 5 units
Subscribe to our ▶️ YouTube channel 🔴 for the latest videos, updates, and tips.
Kindly mail your feedback to v4formath@gmail.com
We always appreciate your feedback.
About Us | Contact Us | Privacy Policy
©All rights reserved. onlinemath4all.com

Recent Articles
-
AP Calculus AB Problems with Solutions (Part - 1)
May 29, 26 09:41 PM
 AP Calculus AB Problems with Solutions (Part - 1)
 -
SAT Math Practice Problems with Answers
May 21, 26 01:17 AM
 SAT Math Practice Problems with Answers
 -
Digital SAT Math Questions and Answers (Part - 13)
May 17, 26 09:03 AM
 Digital SAT Math Questions and Answers (Part - 13)