HOW TO CALCULATE MARGINAL RELATIVE FREQUENCY
Subscribe to our ▶️ YouTube channel 🔴 for the latest videos, updates, and tips.
Marginal relative frequency is one of the types of relative frequency that we can obtain from a two-way frequency table.
A marginal relative frequency can be calculated by dividing a row total or a column total by the Grand total.
Let us look at some examples to understand how to calculate marginal relative frequency.
Example 1 :
A survey is conducted among school students. 50 students are randomly selected and they are asked, whether they prefer dogs, cats or other pets. The table given below shows the results of the survey.
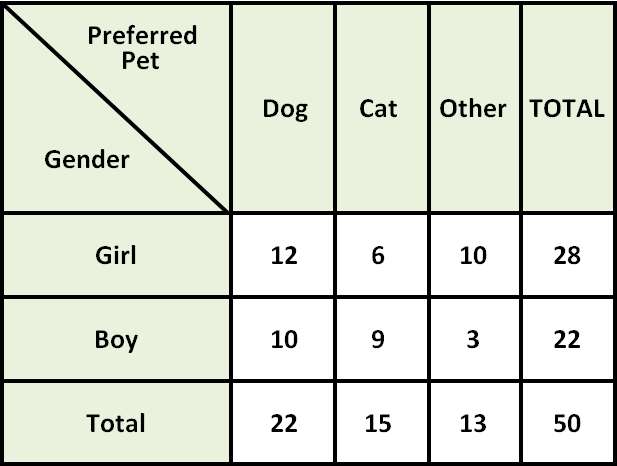
Use the above table to find each marginal relative frequency.
(i) Find the marginal relative frequency of the students who prefer cats as pets.
(ii) Find the marginal relative frequency of boys.
(iii) Find the marginal relative frequency of girls.
(iv) Find the marginal relative frequency of the students who prefer dogs as pets.
Solution (i) :
Divide the total number of students who prefer cats as pets by the grand total. Express your answer as a decimal and as a percent.
15/50 = 0.30 = 30%
Solution (ii) :
Divide the total number of boys by the grand total. Express your answer as a decimal and as a percent.
22/50 = 0.44 = 44%
Solution (iii) :
Divide the total number of girls by the grand total. Express your answer as a decimal and as a percent.
28/50 = 0.56 = 56%
Solution (iv) :
Divide the total number of students who prefer dogs as pets by the grand total. Express your answer as a decimal and as a percent.
22/50 = 0.44 = 44%
Example 2 :
A survey is made among 100 students in a middle school. They are asked, how they travel to school. The table given below shows the results of the survey.
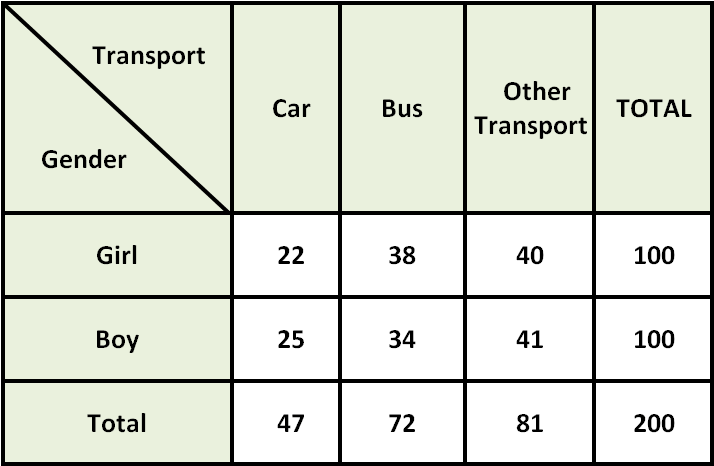
Use the above table to find each conditional relative frequency.
(i) Find the marginal relative frequency of the students who prefer car.
(ii) Find the marginal relative frequency of boys.
(iii) Find the marginal relative frequency of girls.
(iv) Find the marginal relative frequency of the students who prefer bus.
Solution (i) :
Divide the total number of students who prefer car by the grand total. Express your answer as a decimal and as a percent.
47/200 ≈ 0.24 = 24%
Solution (ii) :
Divide the total number of boys by the grand total. Express your answer as a decimal and as a percent.
100/200 = 0.50 = 50%
Solution (iii) :
Divide the total number of girls by the grand total. Express your answer as a decimal and as a percent.
100/200 = 0.50 = 50%
Solution (iv) :
Divide the total number of students who prefer bus by the grand total. Express your answer as a decimal and as a percent.
72/200 = 0.36 = 36%
Example 3 :
You conduct a technology survey to publish on your school’s website. You survey students in the school cafeteria about the technological devices they own. The results are shown in the two-way table. Find and interpret the marginal frequencies.

Solution :
Number of students used cellphones and tablet computer
= 34
Number of students used cellphones and not tablet computer
= 124
Number of students not using cellphones and tablet computer
= 18
Number of students not using cellphones and tablet computer
= 67
total number of students = 34 + 124 + 18 + 67
= 243
Percentage of students who use cellphones and tablet computer
= (34/243) x 100%
= 0.1399 x 100%
= 13.99%
Percentage of students used cellphones and not tablet computer
= (124/243) x 100%
= 0.51 x 100%
= 51%
Percentage of students not using cellphones and tablet computer
= (18/243) x 100%
= 0.07 x 100%
= 70%
Percentage of students not using cellphones and tablet computer
= (67/243) x 100%
= 0.27 x 100%
= 27%
Example 4 :
You conduct a survey that asks 286 students in your freshman class whether they play a sport or a musical instrument. One hundred eighteen of the students play a sport, and 64 of those students play an instrument. Ninety-three of the students do not play a sport or an instrument. Organize the results in a two-way table. Include the marginal frequencies.
total number of students surveyed = 286
number of students who play sport = 118
Number of students who play instruments = 64
Number of students who do not play a sport or an instrument = 93
Applying the known values in the table.

118 - 64 ==> 54
Number of students dont play sport and instruments
= 286 - 118
= 168
Number of students who dont play sport = 168 - 93
= 75
Total number of students who play sport and instrument
= 64 + 75
= 139
Total number of students who dont play sport and instrument
= 54 + 93
= 147

Subscribe to our ▶️ YouTube channel 🔴 for the latest videos, updates, and tips.
Kindly mail your feedback to v4formath@gmail.com
We always appreciate your feedback.
About Us | Contact Us | Privacy Policy
©All rights reserved. onlinemath4all.com

Recent Articles
-
SAT Math Practice Problems with Answers
May 21, 26 01:17 AM
 SAT Math Practice Problems with Answers
 -
Digital SAT Math Questions and Answers (Part - 13)
May 17, 26 09:03 AM
 Digital SAT Math Questions and Answers (Part - 13)
 -
Problems on Solving Logarithmic Equations
Apr 24, 26 09:30 PM
Problems on Solving Logarithmic Equations

