GRAPHING REAL WORLD SITUATIONS WORKSHEET
Subscribe to our ▶️ YouTube channel 🔴 for the latest videos, updates, and tips.
Problem 1 :
Jacob learned how to spell the same number of words each day. Sketch a graph for Jacob's learning to spell words.
Solution :
Jacob learned how to spell the same number of words each day.
Explanation :
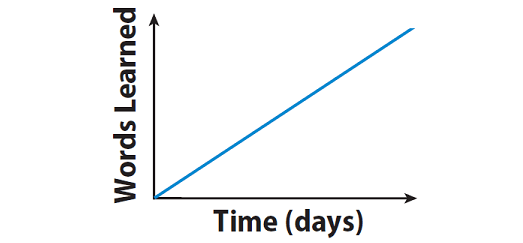
The graph given above shows a constant rate. This means, Jacob learned how to spell the same number of words each day.
Problem 2 :
Prpble Michael started by learning how to spell the same number of words each day but then learned a greater number of words each day. Sketch a graph for Michael's learning to spell words.
Solution :
Michael started by learning how to spell the same number of words each day but then learned a greater number of words each day.
Explanation :
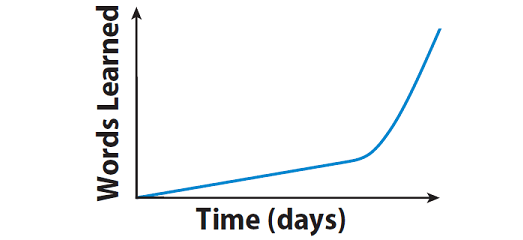
The graph given above begins with a steep curve that gets more shallow. This means, Michael started by learning how to spell the same number of words each day but then learned a greater number of words each day.
Problem 3 :
George started by learning how to spell many words each day but then learned fewer and fewer words each day. Sketch a graph for George's learning to spell words.
Solution :
George started by learning how to spell many words each day but then learned fewer and fewer words each day.
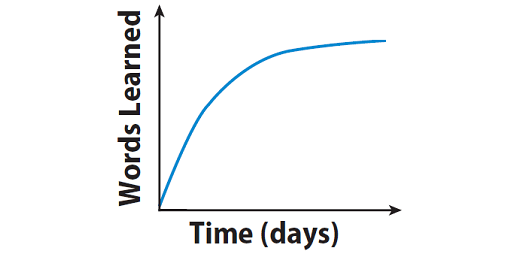
Explanation :
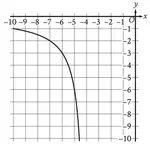
The graph given above begins with a steep curve that gets more shallow. This means, George started by learning how to spell many words each day but then learned fewer and fewer words each day.
Problem 4 :
A person steadily increases his speed for some time, then he maintains the constant rate. Sketch a graph for the above situation.
Solution :
A person steadily increases his speed for some time, then he maintains the constant rate.
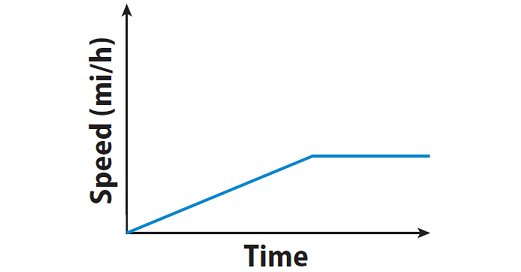
Explanation :
The graph starts with a positive slope and slope becomes zero. This means, the person steadily increases his speed for some time, then he maintains the constant rate.
Problem 5 :
A person begins his ride slowly but then stops to talk with some friends. After a few minutes, he continues his ride, gradually increasing his speed. Sketch a graph for the above situation.
Solution :
A person begins his ride slowly but then stops to talk with some friends. After a few minutes, he continues his ride, gradually increasing his speed.
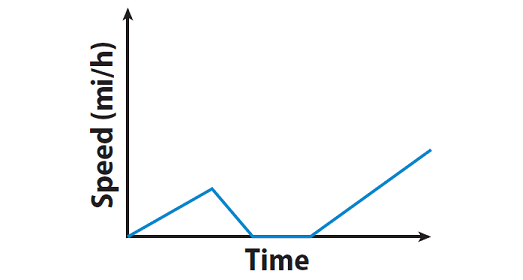
Explanation :
The graph starts with a positive slope, then the slope becomes negative, zero and positive. This means, the person begins his ride slowly but then stops to talk with some friends. After a few minutes, he continues his ride, gradually increasing his speed.
Problem 6 :
A person steadily increases his speed through most of his ride. Then the person A slows down as he nears some trees. Sketch a graph for the above situation.
Solution :
A person steadily increases his speed through most of his ride. Then the person A slows down as he nears some trees.
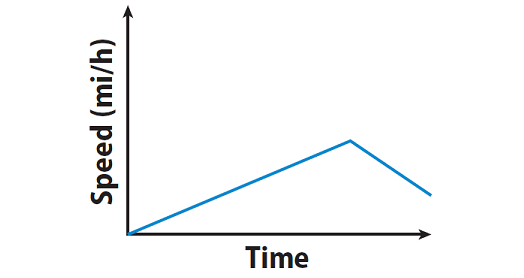
Explanation :
The graph given above starts with a positive slope, then the slope becomes negative. This means, the person steadily increases his speed through most of his ride. Then the person A slows down as he nears some trees.
Porblem 7 :
Rebecca went on a bike ride. This graph shows Rebecca’s distance from home on her bike ride.

a) How far had Rebecca travelled after 30 minutes?
(b) After 60 minutes, Rebecca stopped for a rest. For how many minutes did she rest?
(c) How far did Rebecca travel in total?
Solution :
From the graph, we knwo that x-axis is time in minutes and y-axis is distance from home.
a) By observing the graph, we get the point (30, 6). So, after 30 minutes Rebecca is 8 km away from home.
b) There is a horizontal line in starts at 60 and ends at 90. So, there is 30 minutes.
c) The total distance traveled is 110 km.
Porblem 8 :
Bill is a taxi driver. You can use this graph to find the cost of a taxi for different distances.

For each journey there is a fixed charge plus a charge for the distance.
(a) How much is the fixed charge?
Bill makes two journeys. The distance of one journey is 10 miles further than the other journey.
(b) Work out the difference between the two journey costs.
Solution :
a) The y-intercept is 5, then the fixed charge is £5.
John draws a graph to show the amount of petrol his car used on a 250 mile journey.
Choosing two points, (0, 5) and (10, 20).
b)
- When 0 miles, the amount to be spent is £5
- When 10 miles, the amout to b spent is £20.
Difference between the costs is 20 - 5 ==> £15
Porblem 9 :

(a) How much petrol was in John’s car at the start of his journey?
(b) How many more miles can John’s car travel before it runs out of petrol?
Solution :
a) When John's car starts the journey, the amount of petrol in the tank is 45 liters.
b) It can cover 250 miles.
Subscribe to our ▶️ YouTube channel 🔴 for the latest videos, updates, and tips.
Kindly mail your feedback to v4formath@gmail.com
We always appreciate your feedback.
About Us | Contact Us | Privacy Policy
©All rights reserved. onlinemath4all.com

Recent Articles
-
Digital SAT Math Questions and Answers (Part - 3)
Mar 13, 26 08:41 PM
 Digital SAT Math Questions and Answers (Part - 3)
 -
Digital SAT Math Problems and Solutions (Part - 50)
Mar 13, 26 10:25 AM
 Digital SAT Math Problems and Solutions (Part - 50)
 -
SAT Math Resources (Videos, Concepts, Worksheets and More)
Mar 13, 26 02:08 AM
SAT Math Resources (Videos, Concepts, Worksheets and More)