GRAPHING QUADRATIC FUNCTIONS EXAMPLES
Subscribe to our ▶️ YouTube channel 🔴 for the latest videos, updates, and tips.
Graphing a Quadratic Function in Standard Form
Example 1 :
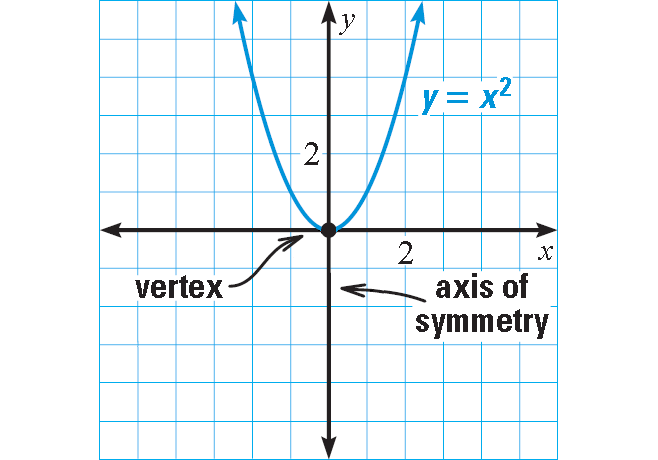
Graph : y = x2
Solution :
The function is in standard form y = ax2 + bx + c.
a = 1, b = 0, and c = 0
Because a > 0, the parabola opens up.
Find and plot the vertex. The x-coordinate is :
x = -b/2a
Substitute.
= 0/2(1)
= 0
The x-coordinate at the vertex is 0 and axis of symmetry is x = 0.
The y-coordinate is :
y = 02
y = 0
So, the vertex is (0, 0).
Draw the axis of symmetry x = 0.
Plot two points on one side of the axis of symmetry, such as (-1, 1) and (-2, 2). Use symmetry to plot two more points, such as (1, 1) and (2, 2).
Draw a parabola through the plotted points.
Example 2 :
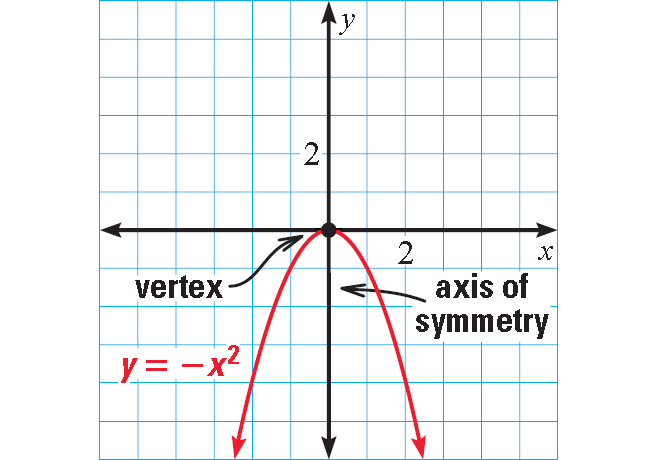
Graph : y = -x2
Solution :
The function is in standard form y = ax2 + bx + c.
a = -1, b = 0, and c = 0
Because a > 0, the parabola opens up.
Find and plot the vertex. The x-coordinate is :
x = -b/2a
Substitute.
= 0/2(-1)
= 0
The x-coordinate at the vertex is 0 and axis of symmetry is x = 0.
The y-coordinate is :
y = -02
y = 0
So, the vertex is (0, 0).
Draw the axis of symmetry x = 0.
Plot two points on one side of the axis of symmetry, such as (-1, -1) and (-2, -2). Use symmetry to plot two more points, such as (1, -1) and (2, -2).
Draw a parabola through the plotted points.
Example 3 :
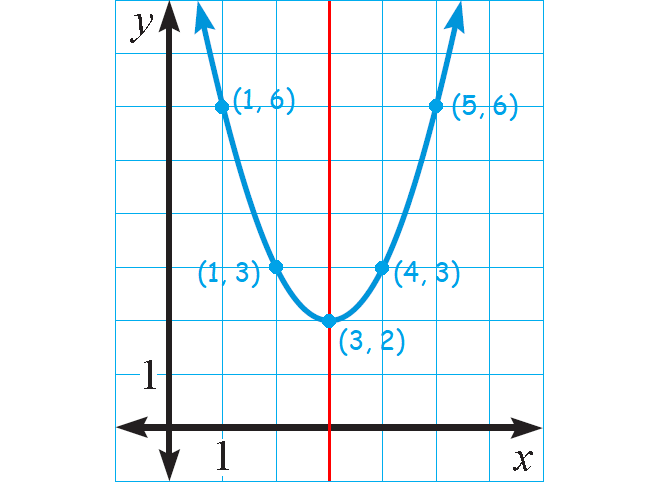
Graph : y = x2 - 6x + 11
Solution :
The function is in standard form y = ax2 + bx + c.
a = 1, b = -6, and c = 11
Because a > 0, the parabola opens up.
Find and plot the vertex. The x-coordinate is :
x = -b/2a
Substitute.
= -(-6)/2(1)
= 6/2
= 3
The x-coordinate at the vertex is 3 and axis of symmetry is x = 3.
The y-coordinate is :
y = 32 - 6(3) + 11
= 9 - 18 + 11
= 2
So, the vertex is (3, 2).
Draw the axis of symmetry x = 3.
Plot two points on one side of the axis of symmetry, such as (1, 3) and (1, 6). Use symmetry to plot two more points, such as (4, 3) and (5, 6).
Draw a parabola through the plotted points.
Graphing a Quadratic Function in Vertex Form
Example 4 :
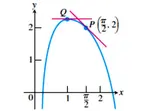
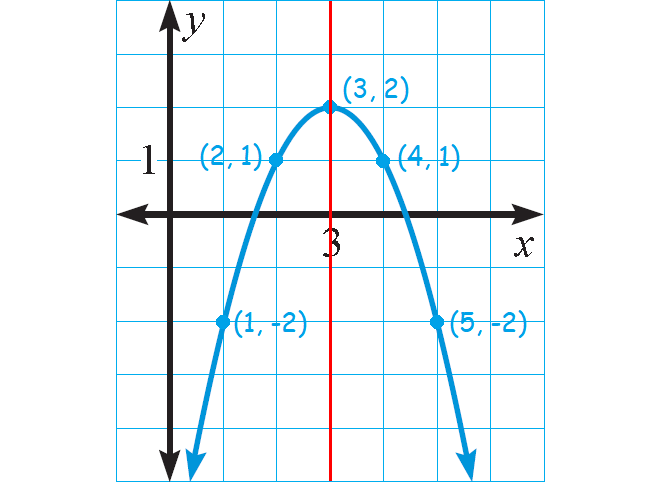
Graph : y = -(x - 3)2 + 2
Solution :
The function is in vertex form y = a(x - h)2 + k.
a = -1, h = 3, and k = 2
Because a < 0, the parabola opens down.
To graph the function, first plot the vertex (h, k) = (3, 2).
Draw the axis of symmetry x = 3.
Plot two points on one side of it, such as (2, 1) and (1, -2). Use symmetry to plot two more points, such as (4, 1) and (5, -2).
Use symmetry to complete the graph.
Graphing a Quadratic Function in Intercept Form
Example 5 :
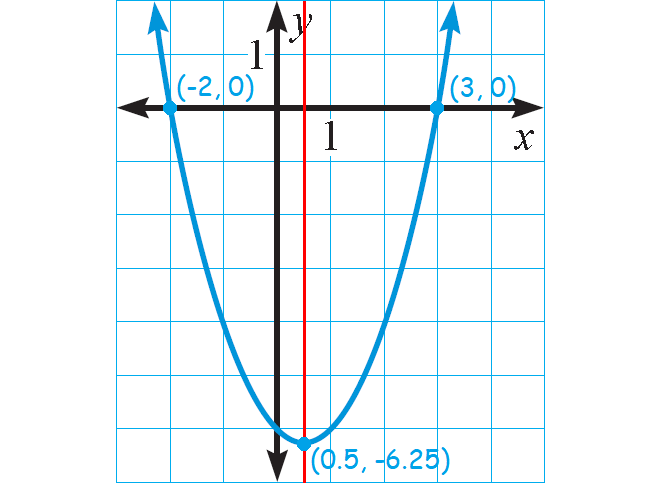
Graph : y = (x + 2)(x - 3)
Solution :
The quadratic function is in intercept form
y = a(x - p)(x - q)
where a = 1, p = -2, and q = 3.
Because a > 0, the parabola opens up.
The x-intercepts occur at (-2, 0) and (3, 0).
The axis of symmetry lies halfway between these points, at x = 0.5.
So, the x-coordinate of the vertex is x = 0.5 and the y-coordinate of the vertex is :
y = (0.5 + 2)(0.5 - 3)
= (2.5)(-2.5)
= -6.25
The graph of the function is shown below.
Sketch the graphs of the following by considering.
i) the value of a
ii) the y-intercept
iii) the x-intercepts
Example 6 :
Graph : y = x2 - 4x + 4
Solution :
i) Comparing the given quadratic function with,
y = ax2 + bx + c
a = 1, the parabola opens upward.
ii) y-intercepts :
Put x = 0
y = 02 - 4(0) + 4
= 0 - 0 + 4
y = 4
iii) x-intercepts :
Put y = 0
y = x2 - 4x + 4
x2 - 4x + 4 = 0
By factoring,
(x - 2) (x - 2) = 0
x = 2 and 2
By analyzing the details, we know that the parabola opens up x intercept is 2 and y-intercept is 4.

Example 7 :
Graph : y = (x - 1) (x + 3)
Solution :
i) Comparing the given quadratic function with,
y = ax2 + bx + c
a = 1, the parabola opens upward.
ii) y-intercepts :
Put x = 0
y = (x - 1) (x + 3)
y = (0 - 1) (0 + 3)
= (-1)(3)
y = -3
iii) x-intercepts :
Put y = 0
y = (x - 1) (x + 3)
(x - 1)(x + 3) = 0
x = 1 and x = -3
By analyzing the details, we know that the parabola opens up x intercept are 1 and -3 and y-intercept is -3.

Example 8 :
Graph : y = 2(x + 2)2
Solution :
i) Comparing the given quadratic function with,
y = ax2 + bx + c
a = 2, the parabola opens upward.
ii) y-intercepts :
Put x = 0
y = 2(x + 2)2
y = 2(0 + 2)2
= 2(4)
y = 8
iii) x-intercepts :
Put y = 0
y = 2(x + 2)2
(x + 2)2 = 0
x + 2 = 0
x = -2
By analyzing the details, we know that the parabola opens up x intercept are -2 1and y-intercept is 8.

Subscribe to our ▶️ YouTube channel 🔴 for the latest videos, updates, and tips.
Kindly mail your feedback to v4formath@gmail.com
We always appreciate your feedback.
About Us | Contact Us | Privacy Policy
©All rights reserved. onlinemath4all.com

Recent Articles
-
AP Calculus AB Problems with Solutions (Part - 1)
May 29, 26 09:41 PM
 AP Calculus AB Problems with Solutions (Part - 1)
 -
SAT Math Practice Problems with Answers
May 21, 26 01:17 AM
 SAT Math Practice Problems with Answers
 -
Digital SAT Math Questions and Answers (Part - 13)
May 17, 26 09:03 AM
 Digital SAT Math Questions and Answers (Part - 13)