GRAPHING LINEAR FUNCTIONS
Subscribe to our ▶️ YouTube channel 🔴 for the latest videos, updates, and tips.
The table shows the total amount of rain that falls in various amounts of time during a heavy rain.
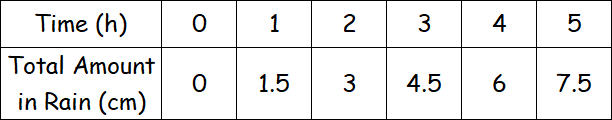
If 'x' denotes time and 'y' denotes total amount of rain, then the relationship between time and total amount of rain can be represented by the equation
y = 1.5x
The graph of the relationship will be a line, so the equation is a linear equation. Since there is exactly one value of y for each value of x, the relationship is a linear function.
Problem 1 :
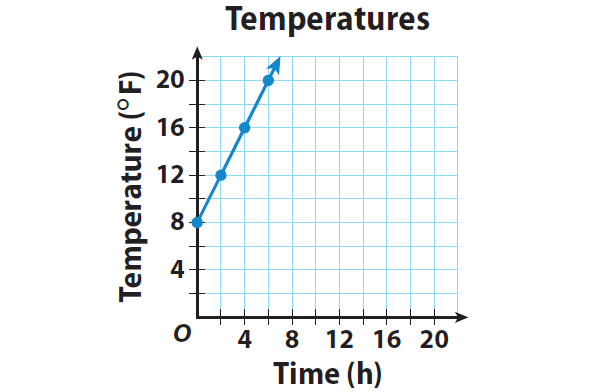
The temperature at dawn was 8 °F and increased steadily 2 °F every hour. The equation y = 2x + 8 gives the temperature y after x hours. State whether the relationship between the time and the temperature is proportional or non proportional. Then graph the function.
Solution :
Step 1 :
The given equation y = 2x + 8 is in slope-intercept form linear equation. That is, y = mx + b.
When we compare the equation y = 2x + 8 with y = mx + b, we get m = 2 and b = 8.
Therefore, the equation is a linear equation. Since b ≠ 0, the relationship is non proportional.
Step 2 :
Choose several values for the input x. Plug these values for x in the equation to find the output y.
x
0
2
4
6
2x + 8
2(0) + 8
2(2) + 8
2(4) + 8
2(6) + 8
y
8
12
16
20
(x, y)
(0, 8)
(2, 12)
(4, 16)
(6, 20)
Step 3 :
Graph the ordered pairs. Then draw a line through the points to represent the solutions of the function.
Problem 2 :
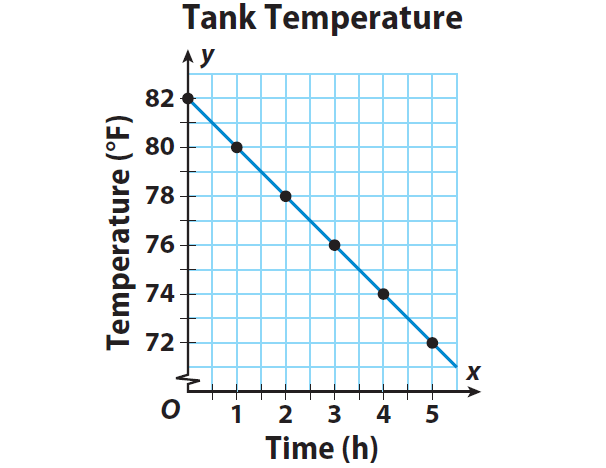
The temperature of a fish tank was 82 °F and decreased steadily 2 °F every hour. The equation y = -2x + 82 gives the temperature y after x hours. State whether the relationship between the time and the temperature is proportional or non proportional. Then graph the function.
Solution :
Step 1 :
The given equation y = -2x + 82 is in slope-intercept form linear equation. That is, y = mx + b.
When we compare the equation y = -2x + 82 with y = mx + b, we get m = -2 and b = 82.
Therefore, the equation is a linear equation. Since b ≠ 0, the relationship is non proportional.
Step 2 :
Choose several values for the input x. Plug these values for x in the equation to find the output y.
x
0
1
2
3
4
5
-2x + 82
-2(0) + 82
-2(1) + 82
-2(2) + 82
-2(3) + 82
-2(4) + 82
-2(5) + 82
y
82
80
78
76
74
72
(x, y)
(0, 82)
(1, 80)
(2, 78)
(3, 76)
(4, 74)
(5, 72)
Step 3 :
Graph the ordered pairs. Then draw a line through the points to represent the solutions of the function.
Problem 3 :
Ellyn has a part-time job in a pizza restaurant. She receives $12 per hour for her work and is required to work between 1 and 4 hours in a shift.
|
Hours worked (x) 1 2 3 4 |
Total pay (y) |
a) Complete the following table of values:
b) Graph the points on a number grid.
c) Does it make sense to join the points? Why or why not?
d) Use your graph to find:
i) how much Ellyn earns if she works 1.5 hours
ii) how long Ellyn must work to earn $30.
Solution :
a) Wages per hour = $12
Total pay be x and number of hours working is x.
y = 12x
|
Hours worked (x) 1 2 3 4 |
Total pay (y) y = 12(1) ==> $12 y = 12(2) ==> $24 y = 12(3) ==> $36 y = 12(4) ==> $48 |
b)

c) Yes, it makes sense to join the points because it is possible for Ellyn to work part of an hour
d) i) When x = 1.5
y = 12(1.5)
If Ellyn works 1.5 hours she earns $18.
When y = 30
30 = 12x
x = 30/12
y = 2.5
To earn $30 Ellyn must work for 2.5 hours.
Problem 4 :
Daniel has $8 to spend on flowers for his garden bed. He buys x punnets of marigolds and y punnets of petunias. Each of the punnets costs $1, and he spends all of his money.
a) Copy and complete this table which shows the different combinations he could buy

b) Graph the information in the table on a number grid.
c) Are the points collinear?
d) Write a relationship between x and y.
e) Is it meaningful to join the points with straight line segments?
Solution :
a) Amount spent for x punnets of marigolds and y punnets of petunias = 8
x + y = 8
|
punnets of marigolds(x) 0 1 2 3 4 5 6 7 8 |
punnets of petunias(y) 8 7 6 5 4 3 2 1 0 |
b)

c) Yes, the points are collinear.
d) x + y = 8Write a relationship between x and y.
e) Yes, it creates a linear relationship. That's why we get the straight line as graphical form.
Problem 5 :
A cereal bar contains 130 calories. The number c of calories consumed is a function of the number b of bars eaten.
a. Does this situation represent a linear function? Explain.
b. Find the domain of the function. Is the domain discrete or continuous? Explain.
c. Graph the function using its domain.
d. Find the range of the function.
Solution :
a. As b increases by 1, c increases by 130. The rate of change is constant.
So, this situation represents a linear function.
b. You can eat part of a cereal bar. The number b of bars eaten can be any value greater than or equal to 0. So, the domain is b ≥ 0, and it is continuous.
c. Step 1 :
Make an input-output table to find ordered pairs.
|
Input 0 1 2 3 4 |
Output 0 130 260 390 520 |
(b, c) (0, 0) (1, 130) (2, 260) (3, 390) (4, 520) |
Step 2 :
Plot the ordered pairs.
Step 3 :
Draw a line through the points. The line should start at (0, 0) and continue to the right. Use an arrow to indicate that the line continues without end, as shown. The domain is continuous. So, the graph is a line with a domain of b ≥ 0.
d. From the graph or table, you can see that the output values are greater than or equal to 0.
So, the range is c ≥ 0.

Subscribe to our ▶️ YouTube channel 🔴 for the latest videos, updates, and tips.
Kindly mail your feedback to v4formath@gmail.com
We always appreciate your feedback.
About Us | Contact Us | Privacy Policy
©All rights reserved. onlinemath4all.com

Recent Articles
-
AP Calculus AB Problems with Solutions (Part - 1)
May 29, 26 09:41 PM
 AP Calculus AB Problems with Solutions (Part - 1)
 -
SAT Math Practice Problems with Answers
May 21, 26 01:17 AM
 SAT Math Practice Problems with Answers
 -
Digital SAT Math Questions and Answers (Part - 13)
May 17, 26 09:03 AM
 Digital SAT Math Questions and Answers (Part - 13)