GRAPHING LINEAR EQUATIONS IN TWO VARIABLES
Subscribe to our ▶️ YouTube channel 🔴 for the latest videos, updates, and tips.
The graph of a linear equation in two variables will be a straight line.
Different Forms of Linear Equations
General form :
ax + by + c = 0
Standard form :
ax + by = c
Slope-Intercept form :
y = mx + b
where 'm' is the slope and 'b' is the y-intercept
Equation of a line parallel to y-axis :
x = a
Equation of a line parallel to x-axis :
y = b
Equation of y-axis :
x = 0
Equation of x-axis :
y = 0
To graph a linear equation in two variables, make sure that the given linear equation is in slope-intercept form. If the given linear equation is in general form or standard form, write it in slope-intercept form.
Once you get the equation in slope intercept form, you can substitute some random values for x and find the corresponding values of y.
Write the values of x and y as points in the form (x, y).
Plot these points on a xy-plane and connect them. You will get a straight line as graph.
Example 1 :
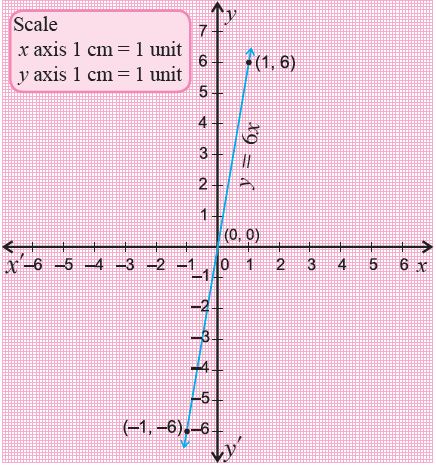
Graph y = 6x.
Solution :
The given equation is in slope-intercept form. Substitute some random values for x and find their corresponding values of y.
When x = -1,
y = 6(-1)
= -6
(-1, 6)
When x = 0,
y = 6(0)
= 0
(0, 0)
When x = 1,
y = 6(1)
= 6
(1, 6)
Plot the points (-1, -6), (0, 0) and (1, 6) on a xy-plane and connect them.
Example 2 :
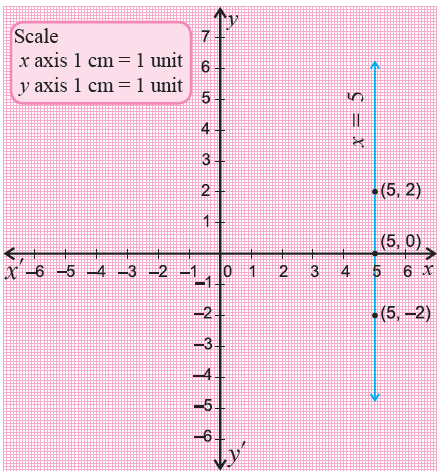
Graph x = 5.
Solution :
x = 5 is the equation of a line parallel to y-axis and also the line is passing through the value '5' on the x-axis.
Draw a straight line parallel to y-axis through the value '5' on the x-axis.
Example 3 :
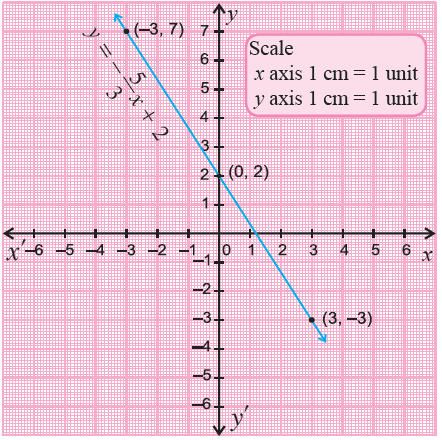
Graph y = -5x/3 + 2.
Solution :
The given equation is in slope-intercept form. Substitute some random values for x and find their corresponding values of y.
In the equation y = 5x/3 + 2, the denominator for the x-term is 3. So, substitute values for x which are the multiples of 3.
When you substitute values for x which are multiples of 3, the values of y will be integer and it will make our graphing process easier.
When x = -3,
y = -5(-3)/3 + 2
= 5 + 2
= 7
(-3, 7)
When x = 0,
y = -5(0)/3 + 2
= 0 + 2
(0, 2)
When x = 3,
y = -5(3)/3 + 2
= -5 + 2
= -3
(3, -3)
Plot the points (-3, 7), (0, 2) and (3, -3) on a xy-plane and connect them.
Example 4 :
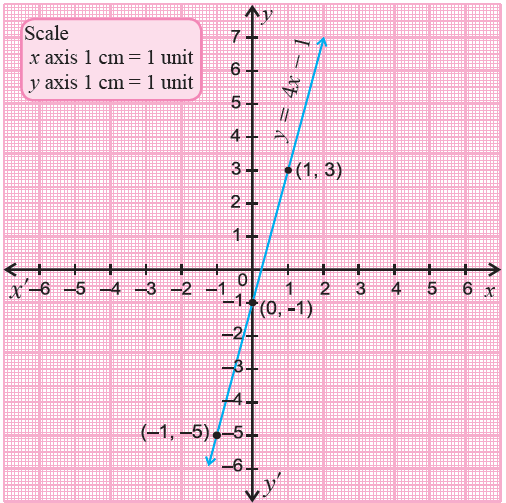
Graph 4x - y - 1 = 0.
Solution :
The given linear equation is not in slope-intercept form. Write the given equation is in slope intercept form.
4x - y - 1 = 0
Add y to both sides.
4x - 1 = y
or
y = 4x - 1
Now the equation is in slope-intercept form. Substitute some random values for x and find their corresponding values of y.
When x = -1,
y = 4(-1) - 1
= -4 - 1
(-1, -5)
When x = 0,
y = 4(0) - 1
= -1
(0, -1)
When x = 1,
y = 4(1) - 1
= 4 - 1
= 3
(1, 3)
Plot the points (-1, -5), (0, -1) and (1, 3) on a xy-plane and connect them.
Example 5 :
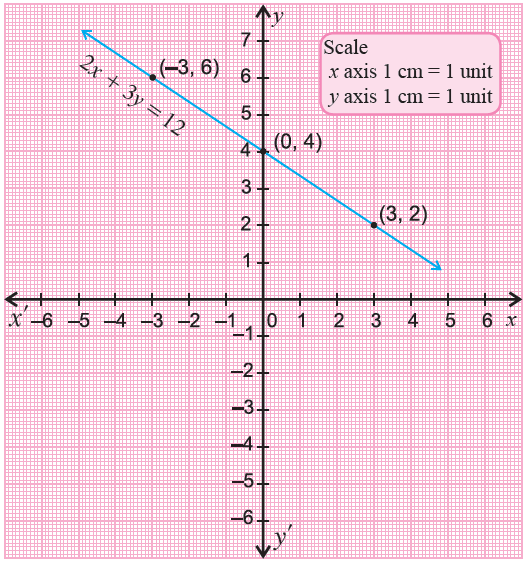
Graph 2x + 3y = 12.
Solution :
The given linear equation is not in slope-intercept form. Write the given equation is in slope intercept form.
2x + 3y = 12.
Subtract 2x from both sides.
3y = -2x + 12
Divide both sides by 3.
y = -2x/3 + 4
Now the equation is in slope-intercept form. Substitute some random values for x and find their corresponding values of y.
When x = -3,
y = -2(-3)/3 + 4
= 2 + 4
= 6
(-3, 6)
When x = 0,
y = -2(0)/3 + 4
= 0 + 4
= 4
(0, 4)
When x = 3,
y = -2(3)/3 + 4
= -2 + 4
= 2
(3, 2)
Plot the points (-3, 6), (0, 4) and (3, 2) on a xy-plane and connect them.
Graphing a Line Using the Slope and Y-Intercept
Example 6 :
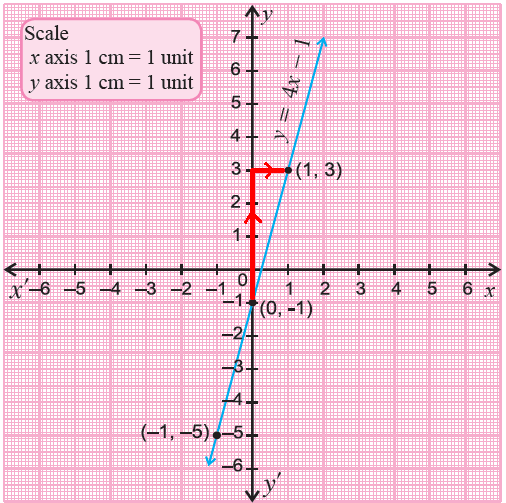
Graph y = 4x - 1.
Solution :
The given linear equation is in slope-intercept form.
Comparing y = mx + b and y = 4x - 1,
slope (m) = 4
y-intercept = -1 ----> (0, -1)
Using rise over run formula for slope,
rise/run = 4
rise/run = 4/1
rise = 4 and run = 1
Since the slope is positive, the graph will be a rising line.
We can do the following steps to graph the given linear equation.
Step 1 :
Plot the y-intercept (0, -1) on a xy-plane.
Step 2 :
rise = 4 ----> move 4 units up from (0, -1)
run = 1 ----> move 1 unit to the right further to (1, 3)
Plot the two points (0, -1) and (1, 3) on a xy-plane connect them with a straight line.
Note :
Since the rise = 4 is a positive value, we move 4 units up from (0, -1).
Incase the rise is a negative value, we have to move down. And for the run, always we have to move to the right.
Example 7 :
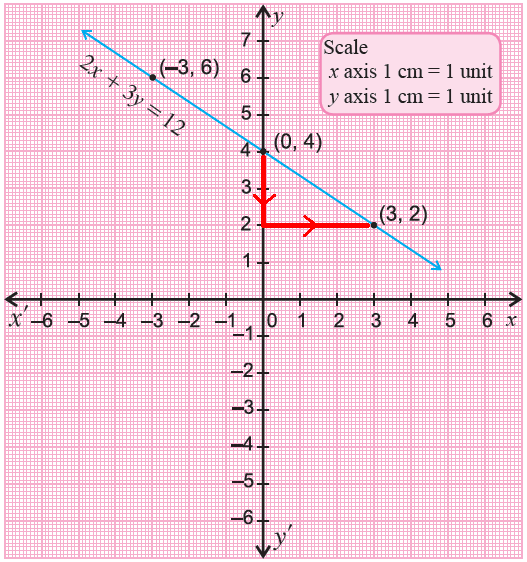
Graph y = -2x/3 + 4.
Solution :
The given linear equation is in slope-intercept form.
Comparing y = mx + b and y = -2x/3 + 4,
slope (m) = -2/3
y-intercept = 4 ----> (0, 4)
Using rise over run formula for slope,
rise/run = -2/3
rise = -2 and run = 3
Since the slope is positive, the graph will be a falling line.
We can do the following steps to graph the given linear equation.
Step 1 :
Plot the y-intercept (0, 4) on a xy-plane.
Step 2 :
rise = -2 ----> move 2 units down from (0, 4)
run = 3 ----> move 3 units to the right further to (3, 2)
Plot the two points (0, 4) and (3, 2) on a xy-plane connect them with a straight line.
Since the rise = -2 is a negative value, we move 2 units down from (0, 4).
Subscribe to our ▶️ YouTube channel 🔴 for the latest videos, updates, and tips.
Kindly mail your feedback to v4formath@gmail.com
We always appreciate your feedback.
About Us | Contact Us | Privacy Policy
©All rights reserved. onlinemath4all.com

Recent Articles
-
Digital SAT Math Questions and Answers (Part - 13)
May 10, 26 05:50 PM
 Digital SAT Math Questions and Answers (Part - 13)
 -
Problems on Solving Logarithmic Equations
Apr 24, 26 09:30 PM
Problems on Solving Logarithmic Equations -
Solving Logarithmic Equations Worksheet
Apr 24, 26 09:05 PM
 Solving Logarithmic Equations Worksheet