GRAPHING GREATEST INTEGER FUNCTION
Subscribe to our ▶️ YouTube channel 🔴 for the latest videos, updates, and tips.
The greatest integer function is denoted by
y = [x]
For all real values of x, the greatest integer function returns the greatest integer which is less than or equal to x.
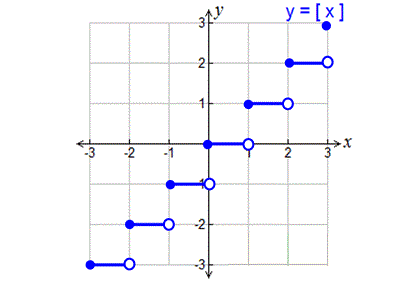
To graph the parent function y = [x], we have to substitute some random values for x.
Substitute x = -3, -2, -1, 0, 1, 2, 3.
y = [-3] = -3 ----> (-3, -3)
y = [-2] = -2 ----> (-2, -2)
y = [-1] = -1 ----> (-1, -1)
y = [0] = 0 ----> (0, 0)
y = [1] = 1 ----> (1, 1)
y = [2] = 2 ----> (2, 2)
y = [3] = 3 ----> (3, 3)
How to plot the above points on the graph?
Let us take the point (-3, -3).
Mark the point on xy- plane with a filled circle at (-3, -3).
Then extend a line for 1 space on the left side of (-3, -3) and end up with empty circle.
Do the same thing for the other points too.
Now you will have a graph as given below.
Graphing Greatest Integer Function - Steps
Step 1 :
When you want to graph a greatest integer function, first graph the parent function.(as explained above)
Step 2 :
Write any parent function in the form as given below.
y - a = [x - b]
Step 3 :
Now equate 'y - a' and 'x - b' to zero.
y - a = 0 ----> y = a
x - b = 0 ----> x = b
Step 4 : (vertical shift)
(i) If you have y = 0, there is no vertical shift.
(ii) If you have y = a (positive value), then shift the graph up 'a' units.
(iii) If you have y = -a (negative value), then shift the graph down 'a' units.
Step 5 : (horizontal shift)
(i) If you have x = 0, there is no horizontal shift.
(ii) If you have x = b (positive value), then shift the graph to the right 'b' units.
(iii) If you have x = -b (negative value), then shift the graph to the left 'b' units.
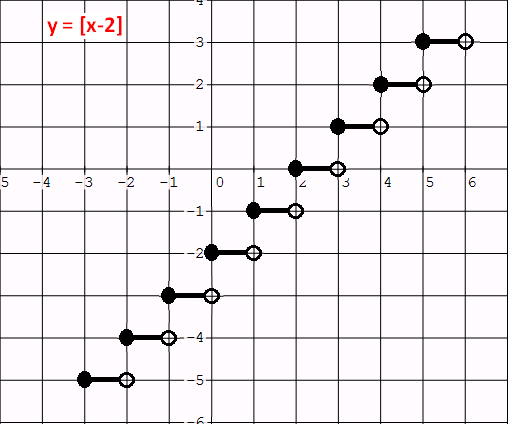
Example 1 :
Graph : y = [x - 2].
Solution :
The given function is in the form of y - a = [x - b].
Let y = 0 and x - 2 = 0. Then, y = 0 and x = 2.
From y = 0, there is no vertical shift.
From x = 2, we have an horizontal shift of 2 units to the right.
So each point of the parent function to be shifted 2 units to the right.
If we do the above transformation, we will have a graph as given below.
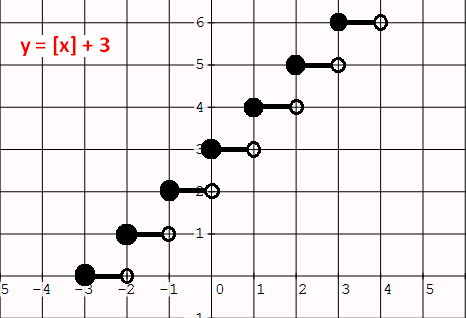
Example 2 :
Graph : y = [x] + 3.
Solution :
If we write the given function in the form of
y - a = [x - b],
we will have y - 3 = [x].
Let y - 3 = 0 and x = 0. Then, y = 3 and x = 2.
From y = 3, we have a vertical shift of 3 units up.
From x = 0, there is no horizontal shift.
So each point of the parent function to be shifted 3 units up.
If we do the above transformation, we will have a graph as given below.
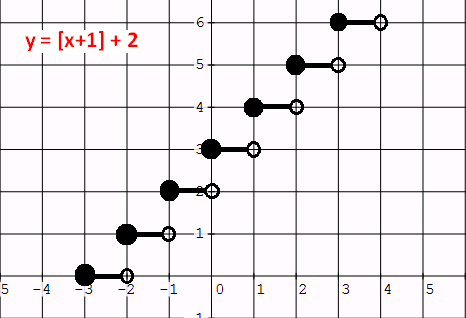
Example 3 :
Graph : y = [x + 1] + 2.
Solution :
If we write the given function in the form of
y - a = [x - b],
we will have y - 2 = [x + 1].
Let y - 2 = 0 and x + 1 = 0. Then y = 2 and x = -1.
From y = 2, we have a vertical shift of 2 units up.
From x = - 1, we have an horizontal shift of 1 unit to the left.
So each point of the parent function to be shifted 2 units up and 1 unit to the left.
If we do the above transformations, we will have a graph as given below.
Subscribe to our ▶️ YouTube channel 🔴 for the latest videos, updates, and tips.
Kindly mail your feedback to v4formath@gmail.com
We always appreciate your feedback.
About Us | Contact Us | Privacy Policy
©All rights reserved. onlinemath4all.com

Recent Articles
-
AP Calculus AB Problems with Solutions (Part - 1)
May 29, 26 09:41 PM
 AP Calculus AB Problems with Solutions (Part - 1)
 -
SAT Math Practice Problems with Answers
May 21, 26 01:17 AM
 SAT Math Practice Problems with Answers
 -
Digital SAT Math Questions and Answers (Part - 13)
May 17, 26 09:03 AM
 Digital SAT Math Questions and Answers (Part - 13)