GRAPH SOLUTIONS TO QUADRATIC INEQUALITIES
Subscribe to our ▶️ YouTube channel 🔴 for the latest videos, updates, and tips.
Let f(x) = ax2 + bx + c, be a quadratic function or expression. a, b, c ∈ R, a ≠ 0
Then f(x) ≥ 0, f(x) > 0, f(x) ≤ 0 and f(x) < 0 are known as quadratic inequalities.
The following general rules will be helpful to solve quadratic inequalities.
Graph Solutions to Quadratic Inequalities - Working Rule
Step 1:
Factorize the quadratic expression and obtain its solution by equating the linear factors to zero.
Step 2 :
Plot the roots obtained on real line. The roots will divide the real line in three parts.
Step 3 :
In the right most part, the quadratic expression will have positive sign and in the left most part, the expression will have positive sign and in the middle part, the expression will have negative sign.
Step 4 :
Obtain the solution set of the given inequality by selecting the appropriate part.
Step 5 :
If the inequality contains equality operator (i.e. ≤, ≥), include the roots in the solution set.
Solved Examples
Example 1 :
Graph and solve for x :
x² - 7x + 6 > 0
Solution :
x² - 7x + 6 > 0
(x - 1)(x - 6) > 0
On equating the factors to zero, we see that x = 1, x = 6 are the roots of the quadratic equation. Plotting these roots on real line and marking positive and negative alternatively from the right most part we obtain the corresponding number line as
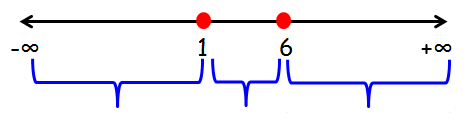
If we plot these points on the number line, we will get intervals (-∞, 1) (1, 6) (6, ∞).
|
From (-∞, 1) let us take -1 |
(-1 − 1) (-1 − 6) > 0 -2(-7) > 0 14 > 0 True |
|
From (1, 6) let us take 4 |
(4 − 1) (4 − 6) > 0 3(-2) > 0 -6 > 0 False |
|
From (6, ∞) let us take 7 |
(7 − 1) (7 − 6) > 0 6(1) > 0 6 > 0 True |
Hence, the solution set is
(− ∞, 1) ∪ (6, ∞)
Example 2 :
Graph and solve for x :
-x² + 3x - 2 > 0
Solution :
-x² + 3x - 2 > 0
Multiplying by negative sign on both sides
x²- 3x + 2 < 0
(x − 1) (x − 2) < 0
x - 1 = 0 x - 2 = 0
x = 1 and x = 2
On equating the factors to zero, we see that x = 1, x = 2 are the roots of the quadratic equation. Plotting these roots on real line and marking positive and negative alternatively from the right most part we obtain the corresponding number line as
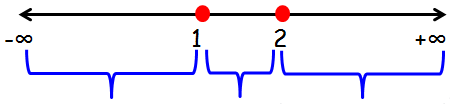
If we plot these points on the number line, we will get intervals (-∞, 1) (1, 2) (2, ∞).
|
From (-∞, 1) let us take -1 |
(x − 1) (x − 2) < 0 (-1 − 1) (-1 − 2) < 0 (-2)(-3) > 0 6 < 0 False |
|
From (1, 2) let us take 1.5 |
(x − 1) (x − 2) < 0 (1.5 − 1) (1.5 − 2) < 0 (-0.5)(-0.5) > 0 0.25 < 0 True |
|
From (2, ∞) let us take 7 |
(7 − 1) (7 − 6) > 0 6(1) > 0 6 > 0 False |
Hence, the solution set is
(1, 2)
Example 3 :
Graph and solve for x :
4x² - 25 ≥ 0
Solution :
4x² - 25 ≥ 0
(2x)² - 5² ≥ 0
(2x - 5) (2x + 5) ≥ 0
2x - 5 ≥ 0 (or) 2x + 5 ≥ 0
x = 5/2 (or) x = -5/2
On equating the factors to zero, we see that x = 5/2, x = -5/2 are the roots of the quadratic equation. Plotting these roots on real line and marking positive and negative alternatively from the right most part we obtain the corresponding number line as
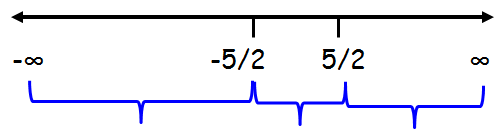
If we plot these points on the number line, we will get intervals (-∞, -5/2) (-5/2, 5/2) (5/2, ∞).Graph solutions to quadratic inequalities
|
From (-∞, -5/2) let us take -3 |
(2x - 5) (2x + 5) ≥ 0 (-6 − 5) (-6 + 5) < 0 (-11)(-1) > 0 11 > 0 True |
|
From (-5/2, 5/2) let us take 0 |
(2x - 5) (2x + 5) ≥ 0 (0− 5) (0 + 5) < 0 (-5)(5) > 0 -25 > 0 False |
|
From (5/2, ∞) let us take 4 |
(2x - 5) (2x + 5) ≥ 0 (8 − 5) (8 + 5) < 0 (3)(13) > 0 39 > 0 True |
Hence, the solution set is
(-∞, -5/2) U (5/2, ∞)
Subscribe to our ▶️ YouTube channel 🔴 for the latest videos, updates, and tips.
Kindly mail your feedback to v4formath@gmail.com
We always appreciate your feedback.
About Us | Contact Us | Privacy Policy
©All rights reserved. onlinemath4all.com

Recent Articles
-
AP Precalculus Problems and Solutions
Jan 31, 26 07:47 PM
 AP Precalculus Problems and Solutions
 -
10 Hard SAT Math Questions (Part - 46)
Jan 27, 26 07:05 AM
 10 Hard SAT Math Questions (Part - 46)
 -
10 Hard SAT Math Questions (Part - 45)
Jan 19, 26 06:14 AM
 10 Hard SAT Math Questions (Part - 45)