FREQUENCY DISTRIBUTION WORKSHEET
Subscribe to our ▶️ YouTube channel 🔴 for the latest videos, updates, and tips.
Problem 1 :
Following are the records of people admitted in intensive care unit of an hospital during a week (M stands for male and F stands for female) :
M F F M F F M M F F
F F M M M F M M F M
M M F M M M F F M F
Construct a frequency-distribution according to gender.
Problem 2 :
A review of a sample of 30 familes reveals the number of persons graduated in each family in western New York.
0 1 3 3 2 5 6 0 1 0
4 1 1 0 2 3 2 5 0 4
2 3 2 2 3 3 4 6 1 4
Make a frequency distribution of the number of persons graduated.
Problem 3 :
Following are the marks scored by 36 grade-10 students in an exam.
70 73 49 61 61 47 57 50 59
59 68 45 55 65 68 56 68 55
70 70 57 44 69 73 64 49 63
65 70 65 62 64 73 67 60 50
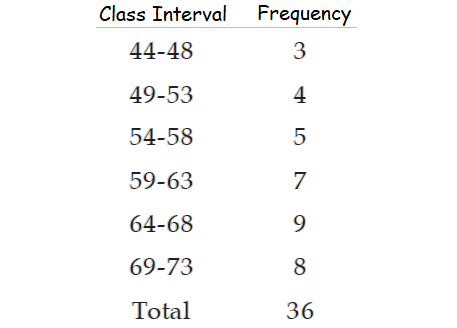
Construct a continuous frequency distribution of marks, taking class length as 5.
Problem 4 :

In the frequency distribution above, find the following.
(i) Frequency denisties for the first two class intervals.
(ii) Relative frequencies for the first two class intervals.
(iii) Percentage frequencies for the first two class intervals.
Problem 5 :
Find the range and its coefficient of range for the following frequency distribution.
|
Class Interval 50 - 54 55 - 59 60 - 64 65 - 69 70 - 74 |
Frequency 12 18 23 10 3 |
Problem 6 :
The following data relate to the distribution of wages of a group of workers :
|
Wages in $ 50 - 60 60 - 70 70 - 80 80 - 90 90 - 100 100 - 110 110 - 120 |
No. of workers 15 23 36 42 17 12 5 |
If a worker is selected at random from the entire group of workers, what is the probability that
(a) his wage would be less than $50?
(b) his wage would be less than $80?
(c) his wage would be more than $100?
(d) his wages would be between $70 and $100?

Answers
1. Answer :
M F F M F F M M F F
F F M M M F M M F M
M M F M M M F F M F
To construct a frequency distribution of people in accordance with their gender, count the number of males and that of females present this information in the following table.
|
Category Male (M) Female (F) Total |
Number of People 16 14 30 |
2. Answer :
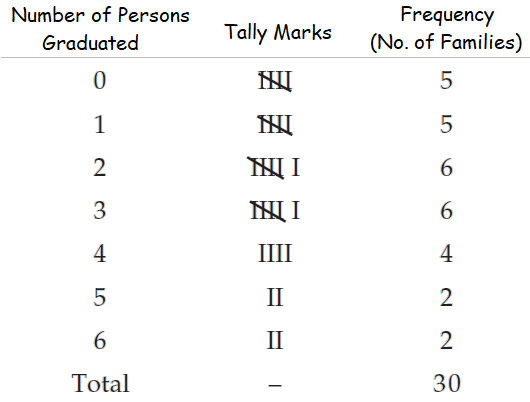
Let x be the number of persons graduated in each family. Since x, the numbers of persons, is a discrete variable, x can assume seven values 0, 1, 2, 3, 4, 5 and 6. Thus we have 7 classes, each class comprising a single value.
Frequency distribution of the number of persons graduated in the 30 families.

3. Answer :
Range = Maximum marks – minimum marks
= 73 – 44
= 29 kgs
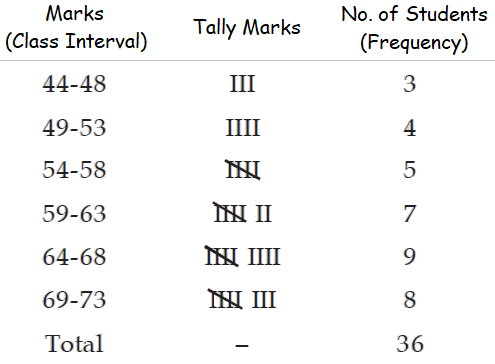
No. of class interval x class length ≅ Range
No. of class interval x 5 ≅ 29
No. of class interval ≅ ²⁹⁄₅
No. of class interval ≅ 6
(We always take the next integer as the number of class intervals so as to include both the minimum and maximum values)
Frequency distribution of marks of 36 students.

4. Answer :

(i) Frequency Density :
It is defined as the ratio of the frequency of that class interval to the corresponding class length.
The class length of each class interval is 5.
Therefore, the frequency densities for the first two class intervals are ⅗ and ⅘ respectively.
(ii) Relative Frequency :
It is defined as the ratio of the class frequency to the total frequency.
Therefore, the relative frequencies for the first two class intervals are ³⁄₃₆ and ⁴⁄₃₆ respectively.
(iii) Percentage Frequency :
It is defined as the ratio of class frequency to the total frequency, expressed as a percentage.
³⁄₃₆ ⋅ 100% ≈ 8.33%
⁴⁄₃₆ ⋅ 100% ≈ 11.11%
Therefore, the percentage frequencies for the first two class intervals are about 8.33% and 11.11% respectively.
5. Answer :
|
Class Interval 50 - 54 55 - 59 60 - 64 65 - 69 70 - 74 |
Frequency 12 18 23 10 3 |
The given class intervals are in class limits. If we convert the class limits to class boundaries,
lowest class boundary = 49.5
highest class boundary = 74.5
Formula to find the range :
Range = Largest value - Smallest value
or
Range = L - S
Range for the given frequency distribution :
= 74.5 - 49.5
= 25
Formula to find the coefficient of range :
Coefficient of range for the given frequency distribution :
≈ 0.2016
6. Answer :
|
Wages in $ 50 - 60 60 - 70 70 - 80 80 - 90 90 - 100 100 - 110 110 - 120 |
No. of workers 15 23 36 42 17 12 5 |
Total no. of workers :
= 15 + 23 + 36 + 42 + 17 + 12 + 5
= 150
Part (a) :
Since there is no worker with wage less than $50, the probability that the wage of a randomly selected worker would be less than $50 is
= ⁰⁄₁₅₀
= 0
Part (b) :
Since there are (15 + 23 + 36) or 74 worker having wages less than $80 out of a group of 150 workers, the probability that the wage of a worker, selected at random from the group, would be less than $80 is
= ⁷⁴⁄₁₅₀
= ³⁷⁄₇₅
Part (c) :
There are (12 + 5) or 17 workers with wages more than $100. Thus the probability of finding a worker, selected at random, with wage more than $100 is
= ¹⁷⁄₁₅₀
Part (d) :
There are (36 + 42 + 17) or 95 workers with wages in between $70 and $100. Thus the probability of finding a worker, selected at random, with wages in between $70 and $100 is
= ⁹⁵⁄₁₅₀
= ¹⁹⁄₃₀
Subscribe to our ▶️ YouTube channel 🔴 for the latest videos, updates, and tips.
Kindly mail your feedback to v4formath@gmail.com
We always appreciate your feedback.
About Us | Contact Us | Privacy Policy
©All rights reserved. onlinemath4all.com

Recent Articles
-
Mastering the SAT Math
Feb 11, 26 06:19 AM
Mastering the SAT Math -
Simplifying Square Roots Worksheet
Feb 10, 26 07:29 AM
Simplifying Square Roots Worksheet -
Simplifying Square Roots
Feb 10, 26 07:26 AM
Simplifying Square Roots - Concept - Solved Questions

