FINDING ASSOCIATIONS BETWEEN VARIABLES
Subscribe to our ▶️ YouTube channel 🔴 for the latest videos, updates, and tips.
We can use conditional relative frequency to check whether there is an association between two variables.
Example 1 :
A survey is made among 200 students in a middle school. They are asked, how they travel to school. The table given below shows the results of the survey.
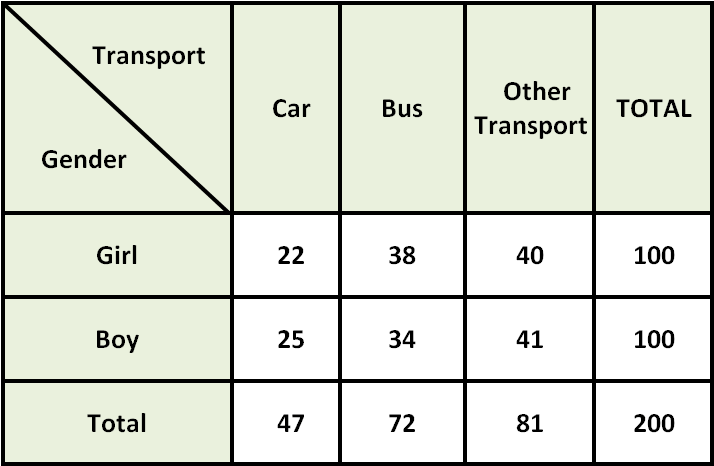
Use the results of the survey to investigate possible influences of gender on transport preferences.
Solution :
Step 1 :
Identify the percent of all students surveyed who are girls.
Required percent is
= Total no. of girls/Total no. of students
= 100/200
= 50%
Step 2 :
Determine each conditional relative frequency.
(i) Of the 47 students who prefer car, 22 are girls.
Percent who are girls, given a preference for car is
= 22/47
≈ 47%
(ii) Of the 72 students who prefer bus, 38 are girls.
Percent who are girls, given a preference for car is
= 38/72
≈ 53%
(iii) Of the 81 students who prefer other transport, 40 are girls.
Percent who are girls, given a preference for car is
= 40/81
≈ 49%
Step 3 :
Interpret the results by comparing each conditional relative frequency to the percent of all students surveyed who are girls.
The percent of girls among students who prefer car is less than 50%, so boys are more likely than girls to prefer car.
The percent of girls among students who prefer bus is greater than 50%, so girls are more likely than boys to prefer bus.
The percent of girls among students who prefer other transport is close to 50%, so gender does not appear to influence preference for other transport.
Example 2 :
A survey is conducted among school students. 50 students are randomly selected and they are asked, whether they prefer dogs, cats or other pets. The table given below shows the results of the survey.
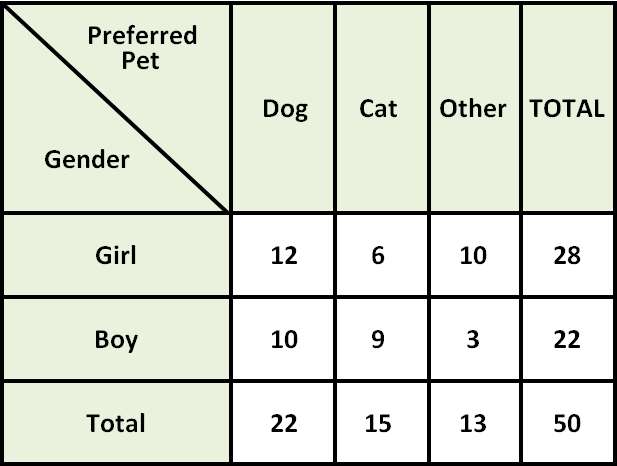
Use the results of the survey to investigate possible influences of gender on pet preferences.
Solution :
Step 1 :
Identify the percent of all students surveyed who are girls.
Required percent is
= Total no. of girls/Total no. of students
= 28/50
= 56%
Step 2 :
Determine each conditional relative frequency.
(i) Of the 22 students who prefer dogs as pets, 12 are girls.
Percent who are girls, given a preference for dogs as pets is
= 12/22
≈ 55%
(ii) Of the 15 students who prefer cats as pets, 6 are girls.
Percent who are girls, given a preference for cats as pets is
= 6/15
= 40%
(iii) Of the 13 students who prefer other pets. 10 are girls.
Percent who are girls, given a preference for other pets is
= 10/13
≈ 77%
Step 3 :
Interpret the results by comparing each conditional relative frequency to the percent of all students surveyed who are girls.
The percent of girls among students who prefer dogs is close to 56%, so gender does not appear to influence preference for dogs.
The percent of girls among students who prefer cats is much less than 56%, so boys are more likely than girls to prefer cats.
The percent of girls among students who prefer cats is much greater than 56%, so girls are more likely than boys to prefer other pets.
Example 3 :
The table below shows the results of a survey regarding Proposition A from two regions of a large city. Four hundred registered voters were surveyed.

a. What is the probability that a randomly chosen person has no opinion on Proposition A?
b. What is the probability that a randomly chosen person is from East given that he or she voted for Proposition A?
c. What is the probability that a randomly chosen person voted against Proposition A and is from West?
Solution :
a) Number of people who has no opinion of Proporsition A
= 35
Total number of people = 400
Probability = 35/400
= 7/80
b) Number of people voted for Proposition A from East
= 90
Total number of people voted for Proposition A = 194
Probability = 90/194
= 45/97
c) Number of people chosen voted against Proposition A and is from West
= 96
Total number of people voted against Proposition A = 400
Probability = 96/400
= 6/25
Example 4 :
The table below shows the number of college faculty members in three departments: biological sciences, education, and social sciences.

a) What is the probability that a randomly chosen faculty member is a female given that she is from Biological Sciences?
b) What is the probability that a randomly chosen faculty member is a male or from Social Sciences?
c) What is the probability that a randomly chosen faculty member is a female from Education department or a male from Social Sciences?
Solution :
a) Number of female from Biological Sciences = 15
Total number of number of biological sciences = 25
Required probability = 15/25
= 3/5
b) Number of male = 55
Number of persons chosen from social science = 36
Number of male and from social science = 19
required probability = (55 + 36 - 19)/108
= 72/108
= 8/9
c) Female from education department = 21
Male from social science = 19
Required probability = (21 + 19)/108
= 40/108
= 10/27
Subscribe to our ▶️ YouTube channel 🔴 for the latest videos, updates, and tips.
Kindly mail your feedback to v4formath@gmail.com
We always appreciate your feedback.
About Us | Contact Us | Privacy Policy
©All rights reserved. onlinemath4all.com
Recent Articles
-
90 Degree Clockwise Rotation
Jan 01, 26 06:58 AM
 90 Degree Clockwise Rotation - Rule - Examples with step by step explanation
 -
US Common Core K-12 Curriculum Algebra Solving Systems of Equations
Jan 01, 26 04:51 AM
US Common Core K-12 Curriculum - Algebra : Solving Systems of Linear Equations -
Solving the HARDEST SAT Math Questions ONLY using Desmos
Dec 31, 25 05:53 AM
Solving the HARDEST SAT Math Questions ONLY using Desmos