FIND DOMAIN AND RANGE FROM A GRAPH
Subscribe to our ▶️ YouTube channel 🔴 for the latest videos, updates, and tips.
Domain :
The domain is the set of possible input values, which are shown horizontally on the x-axis.
Range :
The range is the set of possible output values, which are shown vertically on the y-axis.
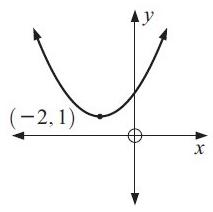
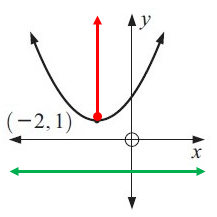
Example 1 :
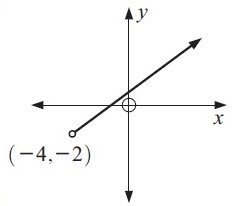
Solution :
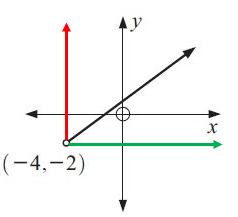
Finding the domain :
In the given graph, the possible values of x are -4, -3, -2 ……… there are spread horizontally on the x-axis.
Because the graph starts at -4 on the x-axis.
So, the domain (x) is x > -4
Finding the range :
In the given graph, the possible values of y are -2, -1, 0 ……… there are spread vertically on the y-axis.
Because the graph starts at -2 on the y-axis.
So, the range (y) is y > -2
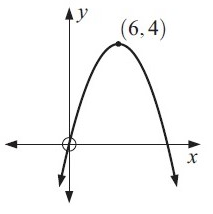
Example 2 :
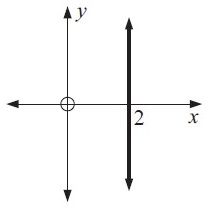
Solution :
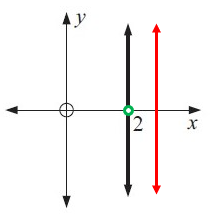
Finding the domain:
In the given graph, the possible value of x is 2. Because the graph is at 2 on the x-axis.
So, the domain (x) is x = 2
Finding the range:
In the given graph, the possible values of y (All the real values)
Because there are spread vertically on the y-axis.
So, the range (y) is in R.
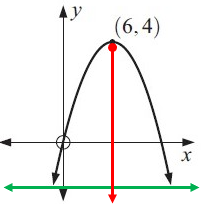
Example 3 :
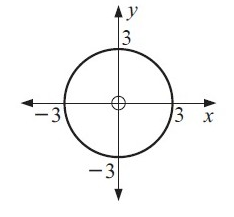
Solution :
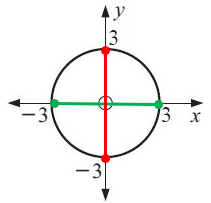
Finding the domain :
In the given graph, the possible values of x are -3, -2, -1, 0, 1, 2, 3 there are spread horizontally on the x-axis.
Because the graph starts at -3 and ends at 3 on the x-axis.
So, the domain (x) is -3 ≤ x ≤ 3
Finding the range :
In the given graph, the possible values of y are -3, -2, -1, 0, 1, 2, 3 there are spread vertically on the y-axis.
Because the graph starts at -3 and ends at 3 on the y-axis.
So, the range (y) is -3 ≤ y ≤ 3
Example 4 :
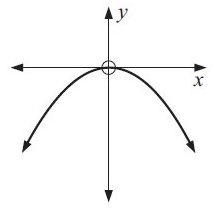
Solution :
Finding the domain :
In the given graph, the possible values of x (All the real values).
Because there are spread horizontally on the x-axis.
So, the domain (x) is in R.
Finding the range :
In the given graph, the possible values of y are 0, -1, -2, -3……… there are spread vertically on the y-axis.
Because the graph starts at 0 on the y-axis.
So, the range (y) is y ≤ 0
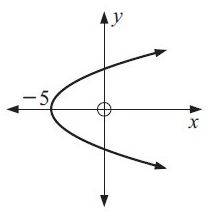
Example 5 :
Solution :
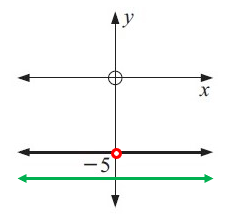
Finding the domain :
In the given graph, the possible values of x (All the real values).
Because there are spread horizontally on the x-axis.
So, the domain (x) is in R.
Finding the range :
In the given graph, the possible value of y is -5. Because the graph is at -5 on the y-axis.
So, the range (y) is y = -5
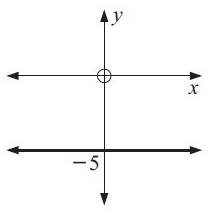
Example 6 :
Solution :
Finding the domain :
In the given graph, the possible values of x (All the real values).
Because there are spread horizontally on the x-axis.
So, the domain (x) is in R.
Finding the range :
In the given graph, the possible values of y are 1, 2, 3, 4……… there are spread vertically on the y-axis.
Because the graph starts at 1 on the y-axis.
So, the range (y) is y ≥ 1
Example 7 :
Solution :
Finding the domain :
In the given graph, the possible values of x (All the real values).
Because there are spread horizontally on the x-axis.
So, the domain (x) is in R.
Finding the range :
In the given graph, the possible values of y are 4, 3, 2, 1……… there are spread vertically on the y-axis.
Because the graph starts at 4 on the y-axis.
So, the range (y) is y ≤ 4
Example 8 :
Solution :
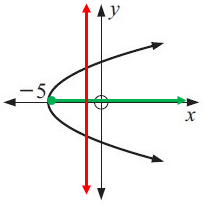
Finding the domain :
In the given graph, the possible values of x are -5, -4, -3, -2……… there are spread horizontally on the x-axis.
Because the graph starts at -5 on the x-axis.
So, the domain (x) is x ≥ -5
Finding the range :
In the given graph, the possible values of y (All the real values).
Because there are spread vertically on the y-axis.
So, the range (y) is in R.
Example 9 :
Joe had a summer job that pays $7.00 an hour and he worked between 15 and 35 hours every week. His weekly salary can be modeled by the equation: S = 7h, where S is his weekly salary and h is the number of hours he worked in a week.
a) Describe the independent variable for this problem.
b) Describe the domain and range for this problem using appropriate notation.
Domain:
Range:
c) What does each value in the ordered pair (20, 140) mean in context of this problem?
Solution :
a)
h is the independent variable (number of hours working)
S is the dependent variable (weekly salary)
b)
Domain is number of hours working and it is 15 hours to 35 hours.
15 ≤ h ≤ 35
range :
|
h = 15 S = 7(15) = 105 |
h = 35 S = 7(35) = 245 |
105 ≤ S ≤ 245
c) (20, 140)
When number of hours is 20, then weekly salary is 140.
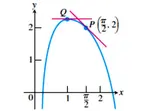
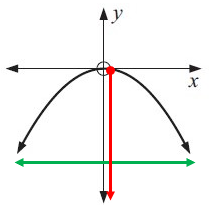
Example 10 :
A ball was thrown into the air with an initial velocity of 72 feet per second. The height of the ball after t seconds is represented by the equation
h = 72t – 16t2
The graph of the function is shown to the below.

a. Describe the dependent variable for this problem.
b. Describe the domain and range for this problem using appropriate notation.
Domain:
Range:
Solution :
a.
Independent variable is time.
Dependent variable is height.
b.
Domain is 0 ≤ t ≤ 4.5
Range is 0 ≤ h < 82
Subscribe to our ▶️ YouTube channel 🔴 for the latest videos, updates, and tips.
Kindly mail your feedback to v4formath@gmail.com
We always appreciate your feedback.
About Us | Contact Us | Privacy Policy
©All rights reserved. onlinemath4all.com

Recent Articles
-
AP Calculus AB Problems with Solutions (Part - 1)
May 29, 26 09:41 PM
 AP Calculus AB Problems with Solutions (Part - 1)
 -
SAT Math Practice Problems with Answers
May 21, 26 01:17 AM
 SAT Math Practice Problems with Answers
 -
Digital SAT Math Questions and Answers (Part - 13)
May 17, 26 09:03 AM
 Digital SAT Math Questions and Answers (Part - 13)