EVALUATE FUNCTIONS FROM THEIR GRAPH
Subscribe to our ▶️ YouTube channel 🔴 for the latest videos, updates, and tips.
Example 1 :
Describe the domain and range of this function :
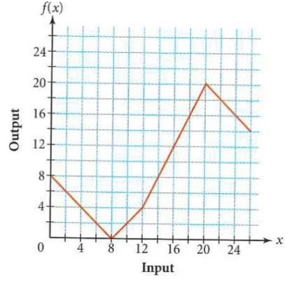
Find the following values : (i) f(18) (ii) f(5) (iii) f(17)
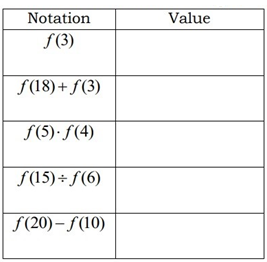
Fill out the table below using the function above :
Solution :
Domain :
To find domain of the function from the graph, we have to check how the function is being spread horizontally.
By observing the graph, it is horizontally spread out from 0 to 25.
So, the domain is 0 ≤ x ≤ 25
Range :
To find range of the function from the graph, we have to check how the function is being spread vertically.
By observing the given graph, the possible values of y are 0, 4, …… 20. So, the range is 0 ≤ y ≤ 20
(i) f(18)
Trace 18 on the curve.
The curve passes through the point (18, 16).
So, the value of f(18) is 16.
(ii)
Trace 5 on the curve.
Now, we are taking approximately at the point 3.
The curve passes through the point (5, 3)
So, the value of f(5) is 3.
(iii)
Trace 17 on the curve.
The curve passes through the point (17, 14)
So, the value of f(17) is 14.
By tracing the notation on the curve, we get the value

Example 2 :
The graph of the function y = f(x) below shows the temperature y outside at different times x over a 24-hour period.
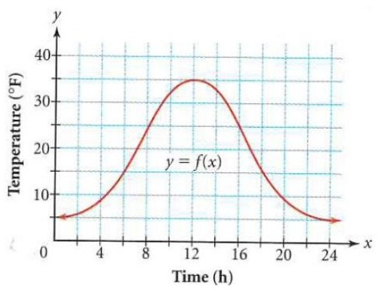
) Find the following : a) Independent variable b) Dependent variable
(ii) Describe the following : a) Domain b) Range
(iii) which of the following would find the temperature at 10 hours ?
a. f(x) = 10
b. f(10)
c. f(h)
d. f(30)
Solution :
(i) a) Independent variable :
Here based on the number of hours the temperature will change.
So, the time will not affect by any other factor but the temperature will be affected by the hours taken.
So, Time (x) is independent variable.
b) Dependent variable :
When time increases the temperature also increases, so temperature is dependent variable.
(ii)
a) Domain :
Over a 24 hour period the temperature has been registered.
So, the domain is 0 ≤ x ≤ 24.
b) Range :
The range are outputs, here output is temperature registered. The minimum temperature is 5 and maximum is 35. So, the range is 5 ≤ x ≤ 35.
(iii)
To calculate the temperature at 10 hours, we will evaluate f(10).
Example 3 :
Look at the graph below :
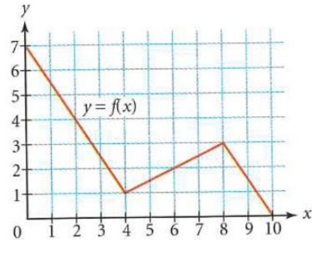
In the graph above f(4) = 1.
(i) Find the following values of the function :
a. f(6) b. f(2) c. f(0) d. f(5)
(ii) For which values of x is this statement true ?
f(x) = 1
Solution :
(i)
a) f(6) :
Trace 6 on the curve.
The curve passes through the point (6, 2).
So, the value of f(6) is 2.
b) f(2) :
Trace 2 on the curve.
The curve passes through the point (2, 4).
So, the value of f(2) is 4.
c) f(0) :
Trace 0 on the curve.
The curve passes through the point (0, 7).
So, the value of f(0) is 7.
d) f(5) :
Trace 5 on the curve.
Now, we are taking approximately at the point 1.5.
The curve passes through the point (5, 1.5).
So, the value of f(5) is 1.5.
(ii) For the given statement, the x value 4 is true.
So, f(4) = 1
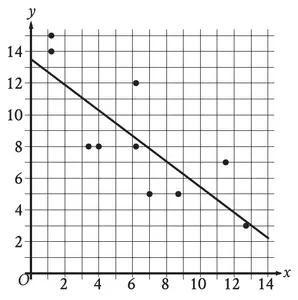
Example 4 :
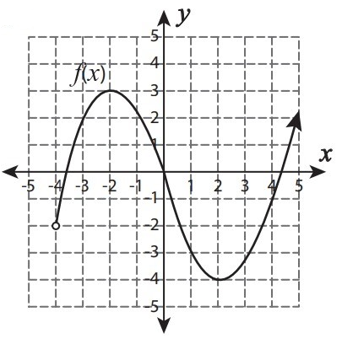
Find the value of x, when
(i) f(x) = 3
(ii) f(x) = -4
(iii) f(1) = ?
(iv) f(-3) = ?
Solution :
(i) By observing 3 on the y-axis, the curve crosses the y-axis at the point (-2, 3)
So, the value of x is -2, when f(x) = 3
(ii) By observing -4 on the y-axis, the curve crosses the y-axis at the point (2, -4)
So, the value of x is 2, when f(x) = -4
(iii) Trace 1 on the curve.
The curve passes through the point (1, -3).
So, the value of f(1) is -3.
(iv) Trace -3 on the curve.
The curve passes through the point (-3, 2).
So, the value of f(-3) is 2.
Example 5 :
Elaine is in the business of repairing home computers. She charges a base fee of $45 for each visit and $25 per hour for her labor. The total cost c(x) for a home visit and x hours of labor is modeled by the function rule
c(x) = 45 + 25x
Use the function rule to make a table of values and a graph.
|
x 0 1 2 3 |
c(x) |
Solution :
c(x) = 45 + 25x
When x = 0
c(0) = 45 + 25(0) ==> 45
When x = 1
c(1) = 45 + 25(1) ==> 70
When x = 2
c(2) = 45 + 25(2) ==> 95
When x = 3
c(3) = 45 + 25(3) ==> 120
(0, 45) (1, 70) (2, 95) and (3, 120)
Plotting these points, we get

Example 6 :
An employee receives a weekly salary of $340 and a 6% commission on all sales.
a. Write a rule to describe the function f(d) that gives weekly earnings in terms of d dollars in sales.
b. Find the employee’s earnings for a week with $660 total sales.
c. What were the employee’s total sales for a week in which her earnings were $1300
Solution :
a)
Weekly salary = $340
Slope = 6%
= 6/100
= 0.06
The required function f(d) = 340 + 0.06d
Here x be the number of weeks.
b. f(d) = 340 + 0.06d
When d = 660
f(660) = 340 + 0.06(660)
= 340 + 39.6
= 379.6
c. When f(d) = 1300
1300 = 340 + 0.06d
1300 - 340 = 0.06d
0.06d = 960
d = 960/0.06
d = 16000
Subscribe to our ▶️ YouTube channel 🔴 for the latest videos, updates, and tips.
Kindly mail your feedback to v4formath@gmail.com
We always appreciate your feedback.
About Us | Contact Us | Privacy Policy
©All rights reserved. onlinemath4all.com

Recent Articles
-
Digital SAT Math Practice Test with Answers (Part - 2)
Apr 13, 26 06:21 PM
 Digital SAT Math Practice Test with Answers (Part - 2)
 -
Digital SAT Math Questions and Answers (Part - 13)
Apr 13, 26 12:18 PM
Digital SAT Math Questions and Answers (Part - 13) -
SAT Math Resources (Videos, Concepts, Worksheets and More)
Apr 09, 26 07:46 PM
SAT Math Resources (Videos, Concepts, Worksheets and More)