DETERMINING DOMAIN AND RANGE FROM GRAPH
Subscribe to our ▶️ YouTube channel 🔴 for the latest videos, updates, and tips.
Key Ideas :
• The domain of a function is the set of values of the independent variable for which the function is defined. The range of a function depends on the equation of the function. The graph depends on the domain and range.
• The domain and range of a function can be determined from its graph, from a table of values, or from the function equation. They are usually easier to determine from a graph or a table of values.
For each relation, state the domain and range and whether the relation is a function.
Example 1 :
Solution :
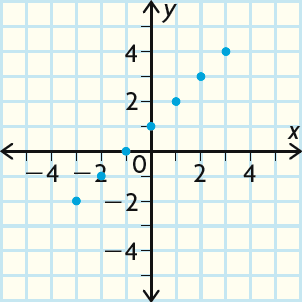
In the graph above, x-coordinates are all the integers from -3 to 3 and the y-coordinates are all the integers from -2 to 4.
Domain = {x ∊ Z | -3 ≤ x ≤ 3} or or {-3, -2, -1, 0, 1, 2, 3}
Range = {y ∊ Z | -2 ≤ x ≤ 4} or {-2, -1, 0, 1, 2, 3, 4}
The graph passes the vertical-line test. So, the graph is a function.
Example 2 :
Solution :
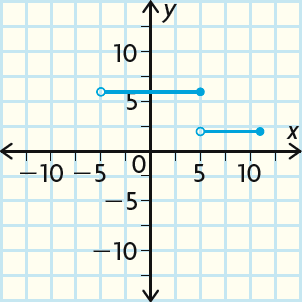
An open circle on the graph shows that the endpoint of the line is not included in the graph. A closed circle means that the endpoint is included. So, x cannot be -5, but it can be 11.
Domain = {x ∊ R | -5 < x ≤ 11}
Range = {2, 6}
The graph passes the vertical-line test. So, the graph is a function.
Example 3 :
Solution :
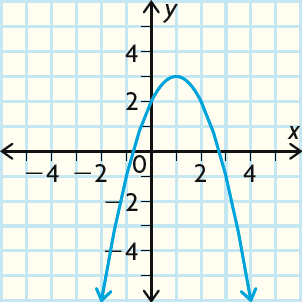
The graph is a parabola with a maximum value at the vertex, which is the point (1, 3).
Therefore, x can be any real number, but y cannot be greater than 3.
Domain = {x ∊ R}
Range = {y ∊ R | y ≤ 3}
The graph passes the vertical-line test. So, the graph is a function.
Example 4 :
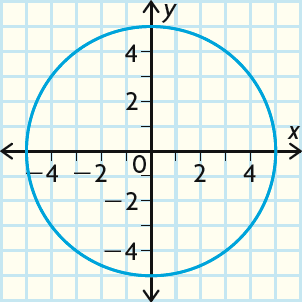
Solution :
The graph is a circle with center (0, 0) and radius of 5.
Domain = {x ∊ R | -5 ≤ x ≤ 5}
Range = {y ∊ R | -5 ≤ y ≤ 5}
The graph fails the vertical-line test. Because, there are many vertical lines that cross the graph in two places. So, this is not a function.
Example 5 :
The number of earrings and headbands you can buy with $24 is represented by the equation 8x + 4y = 24. The table shows the number of earrings and headbands.

a. Write the equation in function form.
b. Find the domain and range.
c. Why is x = 6 not in the domain of the function
Solution :
a) 8x + 4y = 24
4y = 24 - 8x
4y = -8x + 24
y = -8x/4 + 24/4
y = -2x + 6
b) Domain is {0, 1, 2, 3}
Range is {0, 2, 4, 6}
c) When x = 6
y = -2(6) + 6
y = -12 + 6
y = -6
Since we get the value of y as -6, it is not possible. Then x = 6 cannot be domain.
Find the domain and range of the function represented by the graph.
Example 6 :

Solution :
Writing it as ordered pairs, we get
(-2, 3) (0, 2) (2, 1)
Domain = {-2, 0, 2}
Range = {1, 2, 3}
Example 7 :

Solution :
Writing it as ordered pairs, we get
(-1, 0)(1, 0) (-2, -2) (2, -2)
Domain = {-2, -1, 1, 2}
Range = {0, -2}
Example 8 :

Solution :
Writing it as ordered pairs, we get
(2, -2) (3, -2) (4, 1) (5, 3)
Domain = {2, 3, 4, 5}
Range = {-2, 1, 3}
Example 9 :
Describe and correct the error in finding the domain and range of the function represented by the graph.

Solution :
Writing as ordered pairs,
(-3, 4) (-1, 2) (1, 0) (3, -2)
Domain = {-3, -1, 1, 3}
Range = {-2, 0, 2, 4}
From the graph, by observing the ordered pairs, it is clear inputs should be domain and outputs should be range.
But in the given statement, they have changed the domain and range.
Example 10 :
Find the domain and range of the function represented by the table

Solution :
Domain is input, {2, 3, 5, 8}
Range is output, {14, 21, 35, 56}
Example 11 :
In the sport of vaulting, a vaulter performs a routine while on a moving horse. For each round x of competition, the vaulter receives a score y from 1 to 10.
a. Find the domain and range of the function represented by the table.
b. Interpret the domain and range.
c. What is the mean score of the vaulter?

Solution :
a. Domain = {1, 2, 3}
Range = {6.856, 7.923, 8.135}
b. x is number of rounds
y - scores
c. Mean = sum of all scores / total number of scores
= (6.856 + 7.923 + 8.135)/3
= 22.914/3
= 7.638
So, the mean score is 7.638.
Example 12 :
The table shows the percent y (in decimal form) of the moon that was visible at midnight x days after January 24, 2011.
(a) Interpret the domain and range.
(b) What percent of the moon was visible on January 26, 2011?

Solution :
a. Zero days after January 24 is January 24. One day after January 24 is January 25.
So, the domain of 0, 1, 2, 3, and 4 represents January 24, 25, 26, 27, and 28
The range is 0.76, 0.65, 0.54, 0.43, and 0.32.
These amounts are decreasing, so the moon was less visible each day.
b. January 26, 2011 corresponds to the input x = 2. When x = 2, y = 0.54. So, 0.54, or 54% of the moon was visible on January 26, 2011.
Subscribe to our ▶️ YouTube channel 🔴 for the latest videos, updates, and tips.
Kindly mail your feedback to v4formath@gmail.com
We always appreciate your feedback.
About Us | Contact Us | Privacy Policy
©All rights reserved. onlinemath4all.com

Recent Articles
-
AP Calculus AB Problems with Solutions (Part - 1)
May 29, 26 09:41 PM
 AP Calculus AB Problems with Solutions (Part - 1)
 -
SAT Math Practice Problems with Answers
May 21, 26 01:17 AM
 SAT Math Practice Problems with Answers
 -
Digital SAT Math Questions and Answers (Part - 13)
May 17, 26 09:03 AM
 Digital SAT Math Questions and Answers (Part - 13)