DESCRIBING FUNCTIONS
Subscribe to our ▶️ YouTube channel 🔴 for the latest videos, updates, and tips.
The describing function is one of the few widely applicable methods for designing linear and nonlinear systems.
From the graph of the function, we can describe whether the function is linear or non linear.
Let us know how to describe whether a function is linear or non linear through the following examples.
Example 1 :
A square tile has a side length of x inches. The equation y = x2 gives the area of the tile in square inches. Describe whether the function represented by the above equation is linear or non linear. If it is linear, determine whether it is proportional.
Solution :
Step 1 :
To describe whether function represented by the equation is linear or non linear, let us graph the given equation.
Choose several values for the input x. Plug these values for x in the equation to find the output y.
x
1
2
3
4
x2
1²
2²
3²
4²
y
1
4
9
16
(x, y)
(1, 1)
(2, 4)
(3, 9)
(4, 16)
Step 2 :
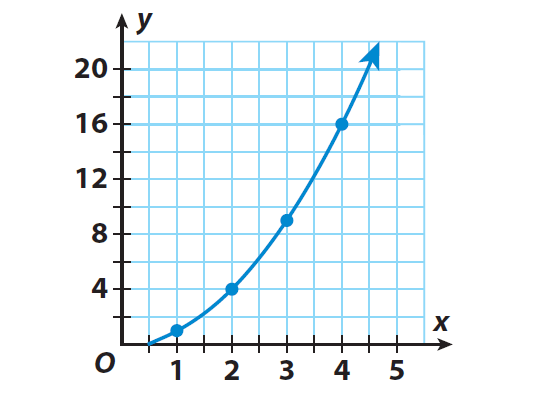
Graph the ordered pairs. Then draw a line through the points to represent the solutions of the function.
Step 3 :
Describe the relationship between x and y.
The graph is not a line. So the relationship between the side length of the square and its area is non linear.
Only a linear relationship can be proportional. Since the relationship is non linear, it is not proportional.
So, the function represented by the equation y = x2 is non linear.
Example 2 :
The temperature of a fish tank was 82 °F and decreased steadily 2 °F every hour. The equation y = -2x + 82 gives the temperature y after x hours. Describe whether the function represented by the above equation is linear or non linear. If it is linear, determine whether it is proportional.
Solution :
Step 1 :
To describe whether function represented by the equation is linear or non linear, let us graph the given equation.
Choose several values for the input x. Plug these values for x in the equation to find the output y.
x
0
1
2
3
4
5
-2x + 82
-2(0) + 82
-2(1) + 82
-2(2) + 82
-2(3) + 82
-2(4) + 82
-2(5) + 82
y
82
80
78
76
74
72
(x, y)
(0, 82)
(1, 80)
(2, 78)
(3, 76)
(4, 74)
(5, 72)
Step 2 :
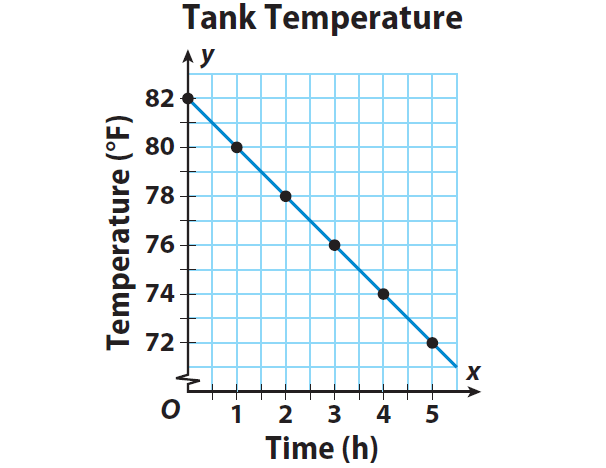
Graph the ordered pairs. Then draw a line through the points to represent the solutions of the function.
Step 3 :
Describe the relationship between x and y.
The graph is a line. So the relationship between the time and the temperature is linear.
But the line is not passing through the origin. So, it is not proportional.
So, the function represented by the equation y = -2x + 82 is linear, but it is not proportional.
Note :
The graphs of all linear relationships will be a line. If the line passes through the origin, the linear relationship is proportional.
If the line does not pass through the origin, the linear relationship is non proportional.
Subscribe to our ▶️ YouTube channel 🔴 for the latest videos, updates, and tips.
Kindly mail your feedback to v4formath@gmail.com
We always appreciate your feedback.
About Us | Contact Us | Privacy Policy
©All rights reserved. onlinemath4all.com

Recent Articles
-
AP Calculus AB Problems with Solutions (Part - 1)
May 29, 26 09:41 PM
 AP Calculus AB Problems with Solutions (Part - 1)
 -
SAT Math Practice Problems with Answers
May 21, 26 01:17 AM
 SAT Math Practice Problems with Answers
 -
Digital SAT Math Questions and Answers (Part - 13)
May 17, 26 09:03 AM
 Digital SAT Math Questions and Answers (Part - 13)