DESCRIBE THE DISTRIBUTION OF THE DATA SET
Subscribe to our ▶️ YouTube channel 🔴 for the latest videos, updates, and tips.
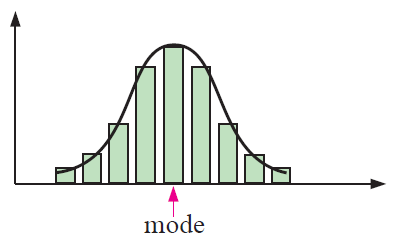
The mode of the data set is most frequently occurring values. Many data set show symmetry or partial symmetry about the mode.
What is symmetrical distribution ?
If we place the curve in column graph we see that this curve shows symmetry. We say that we have symmetrical distribution.
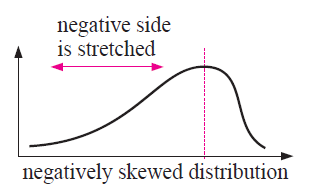
Negatively Stretched :
By comparing with the symmetrical distribution, the curve given below stretched on the left side of the mode.
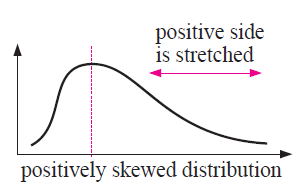
Positively Stretched :
By comparing with the symmetrical distribution, the curve given below stretched on the left side of the mode.
Outliers :
Outliers are the data values that are either much larger or much smaller than the general body data. Outliers appear separated from the body of the data on a frequency graph.
Problem 1 :
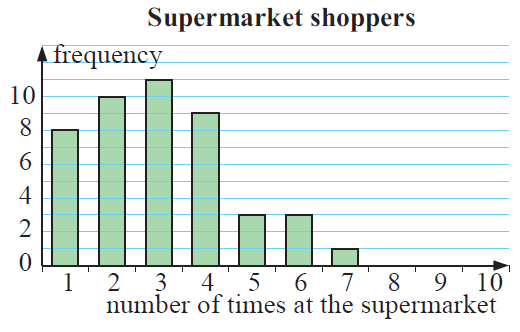
A randomly selected sample of shoppers was asked, ‘How many times did you shop at a supermarket in the past week?’ A column graph was constructed for the results.
a) How many shoppers gave data in the survey?
b) How many of the shoppers shopped once or twice?
c) What percentage of the shoppers shopped more than four times ?
d) Describe the distribution of the data.
Solution :
(a) Meaning of frequency :
8 shoppers visited once in the past week, 10 shoppers visited 2 times per week.
Number of visitors = 8+10+11+9+3+3+1
= 45 shoppers
(b) Number of shoppers visited once or twice = 8 + 10
= 18
(c) Number of shoppers visited more than four times
= 3+3+1
= 7
Percentage of visits the more than four times
= (7/45)⋅100%
= 15.55%
Approximately 15.6% of shoppers visits the shop more than four times.
(d) It is positively skewed and there is no outliers.
Problem 2 :
20 students were asked “How many TV sets do you have in your household?” and the following data was collected:
2 1 0 3 1 2 1 3 4 0
0 2 2 0 1 1 0 1 0 1
a )What is the variable in this investigation?
b) Is the data discrete or continuous? Why?
c) Construct a dot plot to display the data. Use a heading for the graph, and add an appropriate scale and label to each axis.
d) How would you describe the distribution of the data? Is it symmetrical, positively skewed or negatively skewed? Are there any outliers?
e) What percentage of the households had no TV sets?
f) What percentage of the households had three or more TV sets?
Solution :
(a) Variable investigated in this problem is number of TV.
(b) Since number of TV sets is integer, it is discreate data.
(c)
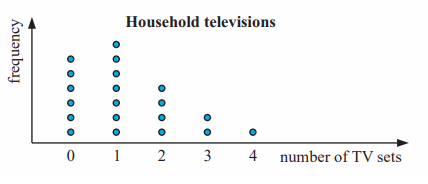
(d) The data set is positively skewed and there is no outliers.
(e) Number of house holds have 0 TV sets = 6
Percentage of house holds have no TV sets
= (6/20) x 100%
= 0.3(100%)
= 30%
(e) Number of house hold have 3 or more TV sets = 3
Percentage = (3/20) x 100%
Problem 3 :
The number of toothpicks in a box is stated as 50 but the actual number of toothpicks has been found to vary. To investigate this, the number of toothpicks in a box was counted for a sample of 60 boxes:
50 52 51 50 50 51 52 49 50 48
51 50 47 50 52 48 50 49 51 50
49 50 52 51 50 50 52 50 53 48
50 51 50 50 49 48 51 49 52 50
49 49 50 52 50 51 49 52 52 50
49 50 49 51 50 50 51 50 53 48
a) What is the variable in this investigation?
b) Is the data continuous or discrete numerical data?
c) Construct a frequency table for this data.
d) Display the data using a bar chart.
e) Describe the distribution of the data.
f) What percentage of the boxes contained exactly 50 toothpicks?
Solution :
In the given data set, the minimum value is 48 and maximum value is 53.
47 is repeated once,48 is repeated 5 times. Like this by counting each value, we can create the table. With the help of table, we can draw bar graph.
(a) Number of toothpicks in each box is the variable investigated.
(b) It is counting number of toothpicks. So it is discrete data.
(c)
|
Number of tooth picks in each box 47 48 49 50 51 52 53 |
Frequency 1 5 10 23 10 9 2 |
(d)
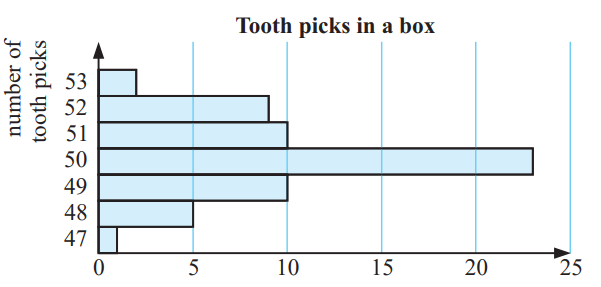
(e) Approximately symmetrical.
(f) Number of boxes which contains 50 toothpicks = 23
Percentage of boxes which contains 50 toothpicks
= (23/60)⋅100%
= 0.383 ⋅ 100%
= 38.3%
Problem 4 :
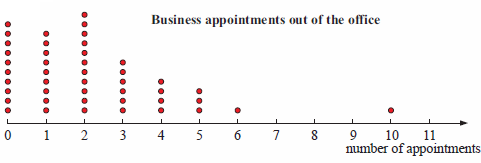
Employees of a company were asked to record the number of times they left the company office on business appointments during one week. The following dot plot was constructed from the data:
a) What is the variable in this investigation?
b) Explain why the data is discrete numerical data.
c) What percentage of the employees did not leave the office?
d) What percentage of the employees left the office more than 5 times?
e) What was the most frequent number of business appointments out of the office?
f) Describe the distribution of the data.
g) How would you describe the data value ‘10’?
Solution :
(a) Number of business appointments is the variable investigated.
(b) Number of business appointments will not be a part, so it is discrete.
(c) Number of times they do not leave the office
= 0 times leave the office
10 people they dont leave from office.
Percentage of people they dont leave office
= (10/45) x 100%
= 22.2%
(d) Percentage of employees left in the office more than 5 times.
= (2/45) x 100%
= 4.44%
(e) Most frequent number of business appointments
= 2 appointments
(f) The distribution is positively skewed with no outlier.
(g) The data value 10 is an outlier.
Subscribe to our ▶️ YouTube channel 🔴 for the latest videos, updates, and tips.
Kindly mail your feedback to v4formath@gmail.com
We always appreciate your feedback.
About Us | Contact Us | Privacy Policy
©All rights reserved. onlinemath4all.com

Recent Articles
-
SAT Math Practice Problems with Answers
May 21, 26 01:17 AM
 SAT Math Practice Problems with Answers
 -
Digital SAT Math Questions and Answers (Part - 13)
May 17, 26 09:03 AM
 Digital SAT Math Questions and Answers (Part - 13)
 -
Problems on Solving Logarithmic Equations
Apr 24, 26 09:30 PM
Problems on Solving Logarithmic Equations

