CUMULATIVE FREQUENCY DISTRIBUTION
Subscribe to our ▶️ YouTube channel 🔴 for the latest videos, updates, and tips.
The cumulative frequency corresponding to a value for a discrete variable and corresponding to a class boundary for a continuous variable may be defined as the number of observations less than the value or less than or equal to the class boundary.
This definition refers to the less than cumulative frequency. We can define more than cumulative frequency in a similar manner.
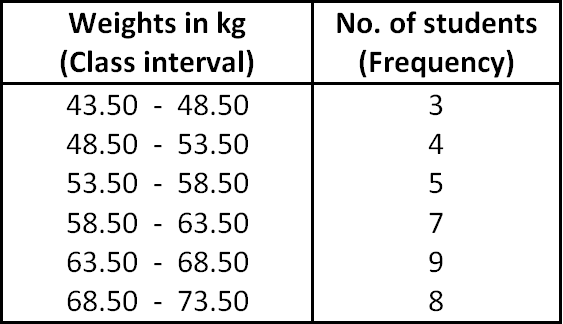
Let us consider the frequency distribution of weights 36 students.
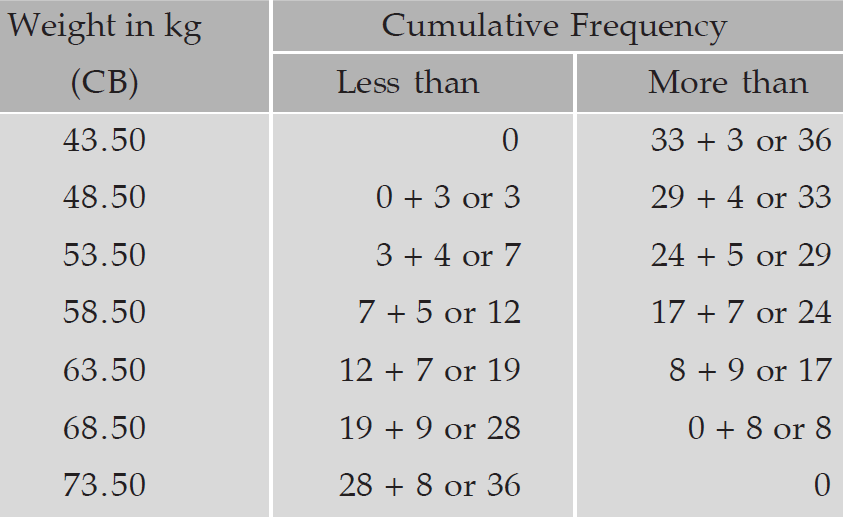
For the above frequency distribution, both less than cumulative and more than cumulative frequency distribution are shown in the table given below.
Construction of Ogives Using Cumulative Frequency
By plotting cumulative frequency against the respective class boundary, we get ogives.
As such there are two ogives – less than type ogives, obtained by taking less than cumulative frequency on the vertical axis and more than type ogives by plotting more than type cumulative frequency on the vertical axis and thereafter joining the plotted points successively by line segments.
Ogives may be considered for obtaining quartiles graphically.
If a perpendicular is drawn from the point of intersection of the two ogives on the horizontal axis, then the x-value of this point gives us the value of median, the second or middle quartile.
Ogives further can be put into use for making short term projections.
Example :
Draw ogives for the following table which represents the frequency distribution of weights of 36 students.
Solution :
To draw ogives for the above frequency distribution, we have to write less than and more than cumulative frequency as given below.
Now, we have to write the points from less than and more than cumulative frequency as given below.
Points from less than cumulative frequency :
(43.50, 0), (48.50, 3), (53.50, 7), (58.50, 12), (63.50, 19), (68.50, 28) and (73.50, 36)
Points from more cumulative frequency :
(43.50, 36 (48.50, 33), (53.50, 29), (58.50, 24), (63.50, 17), (68.50, 8) and (73.50, 0)
Now, taking frequency on the horizontal axis, weights on vertical axis and plotting the above points, we get ogives as given below.
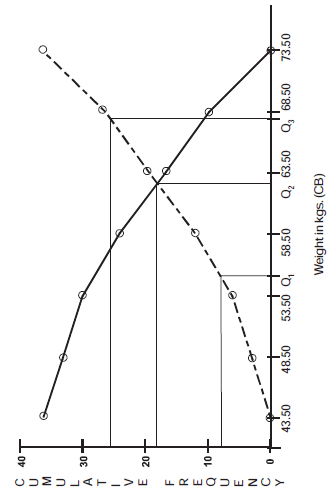
From the points of less than cumulative frequency, we get less than ogive and from the points of more than cumulative frequency, we get more than cumulative ogive.
In the above graph, the dotted curve represents the less than cumulative frequency curve and the solid line represents the more than cumulative frequency curve.
From the above figure which depicts the ogives and the determination of the quartiles. This figure give us the following information.
1st quartile or lower quartile (Q1) = 55 kgs.
2nd quartile or median (Q2 or Me) = 62.50 kgs.
3rd quartile or upper quartile (Q3) = 68 kgs.
Subscribe to our ▶️ YouTube channel 🔴 for the latest videos, updates, and tips.
Kindly mail your feedback to v4formath@gmail.com
We always appreciate your feedback.
About Us | Contact Us | Privacy Policy
©All rights reserved. onlinemath4all.com

Recent Articles
-
AP Calculus AB Problems with Solutions (Part - 1)
May 29, 26 09:41 PM
 AP Calculus AB Problems with Solutions (Part - 1)
 -
SAT Math Practice Problems with Answers
May 21, 26 01:17 AM
 SAT Math Practice Problems with Answers
 -
Digital SAT Math Questions and Answers (Part - 13)
May 17, 26 09:03 AM
 Digital SAT Math Questions and Answers (Part - 13)